Figure 5.
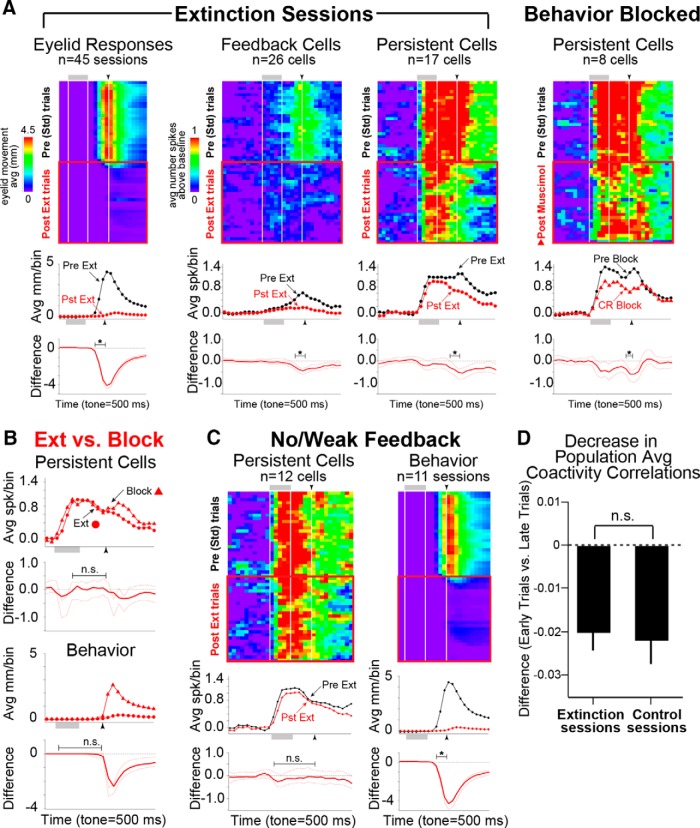
Persistent mPFC cells did not show decreased spike responses as a result of extinction training. Pseudocolored matrices and graphs are as described in Figure 3. A, Comparisons between Std (black) and after full extinction (Pst Ext; red) for behavior (Eyelid Responses, left), CR feedback cells (middle), and persistent cells (right), and for sessions in which behavior was pharmacologically blocked by infusion of muscimol into the cerebellum (Behavior Blocked, far right). Pseudocolored matrices show eyelid position or spike activity during Std and Pst Ext trials, with each row showing eyelid or spike response from one trial, averaged across sessions or cells, respectively. Top graphs show averages from Std trials (black) and from Pst Ext or Post-muscimol infusion trials (red). Bottom graphs show bin-by-bin differences between Std and Post averages (red line) and confidence intervals from bootstrapping (dashed red lines) for each time bin. PFC cells only showed response changes in association with changes in behavioral feedback due to CR extinction, similar to that observed during pharmacological blockade of CRs, suggesting that learning-related changes were not observed. B, Direct comparison of postextinction and pharmacological blockade of CRs indicated that observed changes in spike responses during Pst Ext trials were due to the absence of behavioral feedback alone and not to modification of responses to the tone as a result of extinction training. C, Control comparisons for persistent cells identified as showing No/Weak behavioral feedback support the interpretation that persistent cells did not show changes in spike responses after extinction. The average behavior for sessions that contributed cells to this analysis is also given. D, Correlated activity within simultaneously recorded cell ensembles show decreases in coactive cell pairs after extinction, which was similar to that observed during control sessions, suggesting that changes in ensemble activity occur over time and not in response to extinction training (unpaired t test, p > 0.05). Avg, average.

