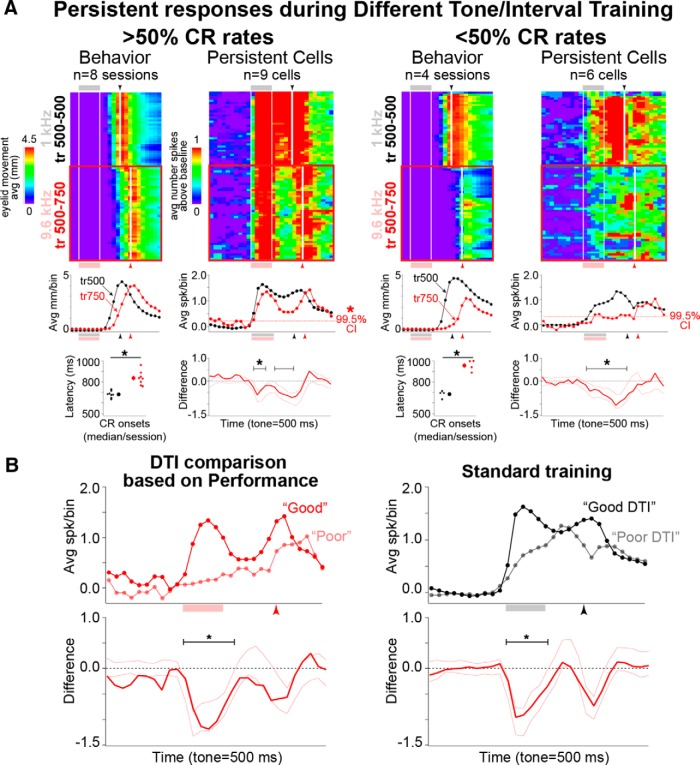
Figure 8.
Higher performance (>50% CR rates) during different tone training was associated with generalized persistent responses, while poorer performance (<50% CR rates) was associated with decreases in persistent responses to near-baseline spike rates. Pseudocolored matrices and line graphs are as previously described. A, Pseudocolored matrices of averaged eyelid behavior and persistent cell responses for different tone training in which rabbits showed >50% or <50% CR rates (good vs poor performance). Rabbits showed good behavioral discrimination between the two tones for good and poor performance sessions (bottom left plots, paired t tests, p < 0.001). Reliable decreases in persistent responses were observed during both good and poor performance sessions. However, mPFC cells maintained a persistent response pattern only when performance was >50% (left, red dashed line in top right graphs = upper confidence interval of bootstrapped baseline). Persistent responses approached baseline levels when performance was <50% (right). B, Direct comparison of persistent cells during good and poor performance during different tone/interval training revealed reliable decreases in persistent responses when behavior was poor (left). Reliable differences were also observed during standard training for these cells, suggesting that weaker tone responses during standard conditions may predict decreased performance in response to the new task conditions.

