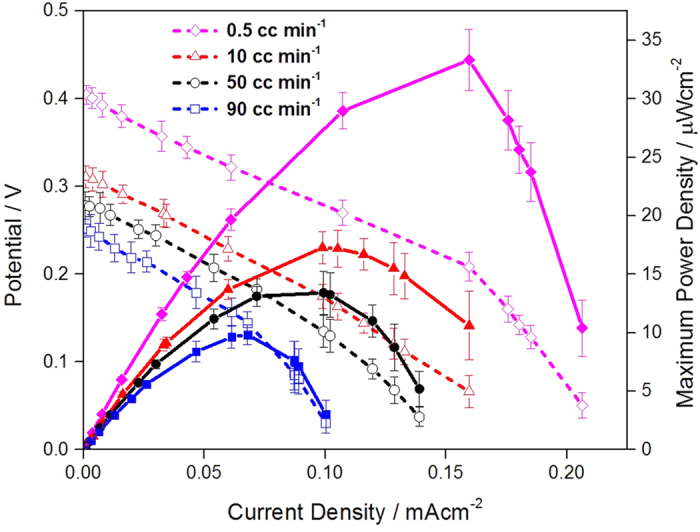
Figure 4. Polarization curves of EBCs adopting GA/[[GOx/PEI]2/CNT] as anodic catalyst and GA/[Lac/PEI/Lac/CNT] as cathodic catalyst.

For the test, in anode, 0.04 M glucose solution (pH 7.4) was provided at a rate of 0.5, 10, 50 and 90 cc · min−1, while for cathode, 100 cc · min−1 O2 gas was supplied. For gaining the corresponding polarization curve, three samples were tested.
