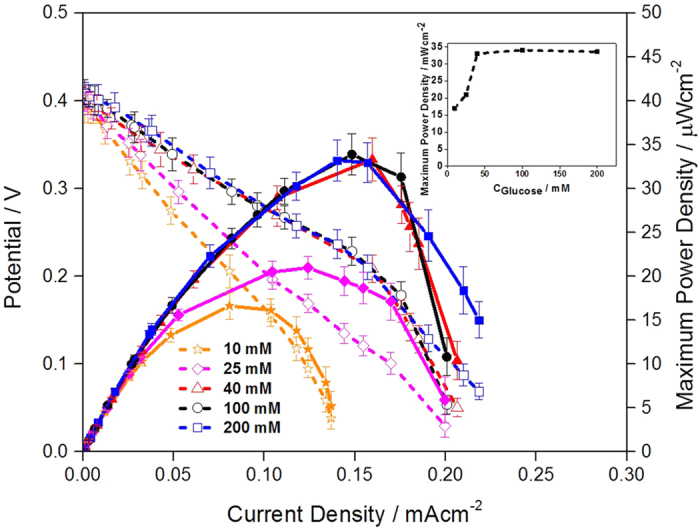
Figure 5. Polarization curves of EBCs adopting GA/[[GOx/PEI]2/CNT] as anodic catalyst and GA/[Lac/PEI/Lac/CNT] as cathodic catalyst.

Inset indicates a correlation between glucose concentration and MPD of EBCs. For the test, in anode, 10, 25, 40, 100 and 200 mM glucose solution (pH 7.4) was supplied, while for cathode, 100 cc · min−1 O2 gas was supplied. For gaining the corresponding polarization curve, three samples were tested.
