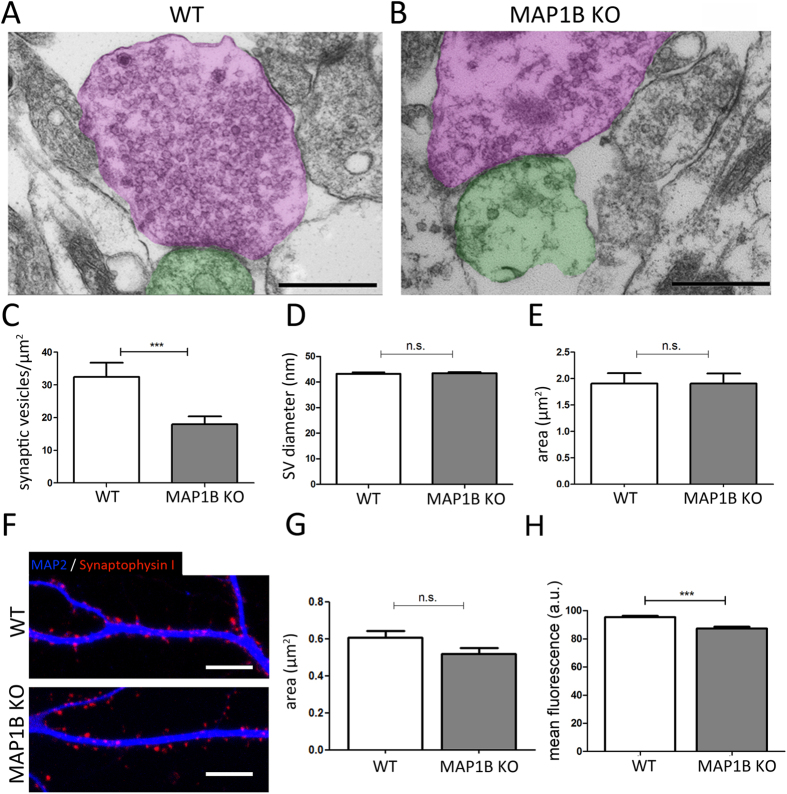
Figure 7. MAP1B KO neurons present a decrease in the synaptic vesicle density at presynaptic terminals, while their area is unaltered.
Representative micrographs of synaptic contacts in (A) WT and (B) MAP1B KO mature neurons. Presynaptic terminals are pseudocolored in magenta, and postsynaptic terminals in green. Scale bars 500 nm. (C) Quantification of SV density in presynaptic terminals (WT neurons, 32.42 ± 4.38 vesicles/μm2; MAP1B KO neurons, 17.97 ± 2.40 vesicles/μm2; non-parametric Mann-Whitney test p = 0.0007). (D) Quantification of SV diameter (WT neurons, 43.23 ± 0.51 nm; MAP1B KO neurons, 43.39 ± 0.50 nm; unpaired Student’s t-test, not significant (n.s.)) (E) Quantification of presynaptic terminal surface area (WT neurons, 1.905 ± 0.20 μm2; MAP1B KO neurons, 1.903 ± 0.19 μm2; unpaired Student’s t-test n.s). (F) Representative immunocytochemical image of Synph I-positive presynaptic terminals in apposition to MAP2-positive dendrites in WT (upper panel) and MAP1B KO neurons (lower panel). Scale bar 10 μm. (G) Quantification of presynaptic terminal surface by ImageJ reconstruction (WT neurons, 0.605 ± 0.04 μm2; MAP1B KO neurons, 0.517 ± 0.03 μm2; unpaired Student’s t-test n.s). (H) Quantification of Synph I-positive presynaptic terminal mean fluorescence intensity by ImageJ reconstruction (WT neurons, 95.26 ± 1.07 a.u.; MAP1B KO neurons, 87.25 ± 1.39 a.u.; unpaired Student’s t-test p < 0.0001).

