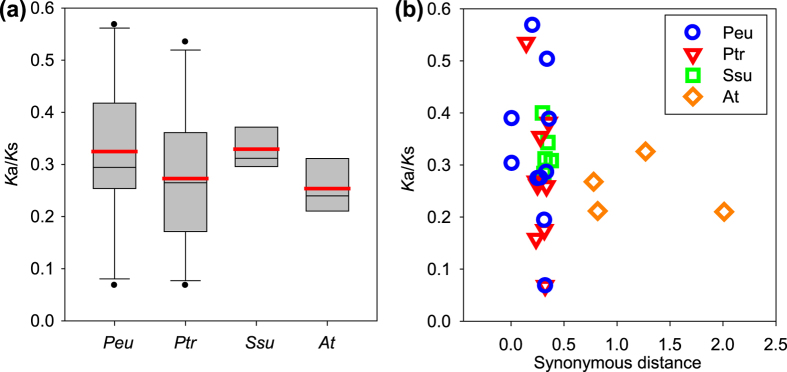
Figure 3. Estimates of Ka/Ks ratios in pairwise comparisons in four species Hsf families.
(a) Average molecular evolutionary rate (Ka/Ks) for Hsf genes in P. euphratica (Peu), P. trichocarpa (Ptr), S. suchowensis (Ssu), and A. thaliana (At). Red line in each box indicates average value of Ka/Ks in each species. (b) The Ka/Ks ratios of the duplicated Hsf genes in four species are shown in the scatter plots, the y and x axes denote the Ka/Ks ratio and synonymous distance for each pair. The detail of the Ka and Ks in the four species was listed in Supplementary Table S3.

