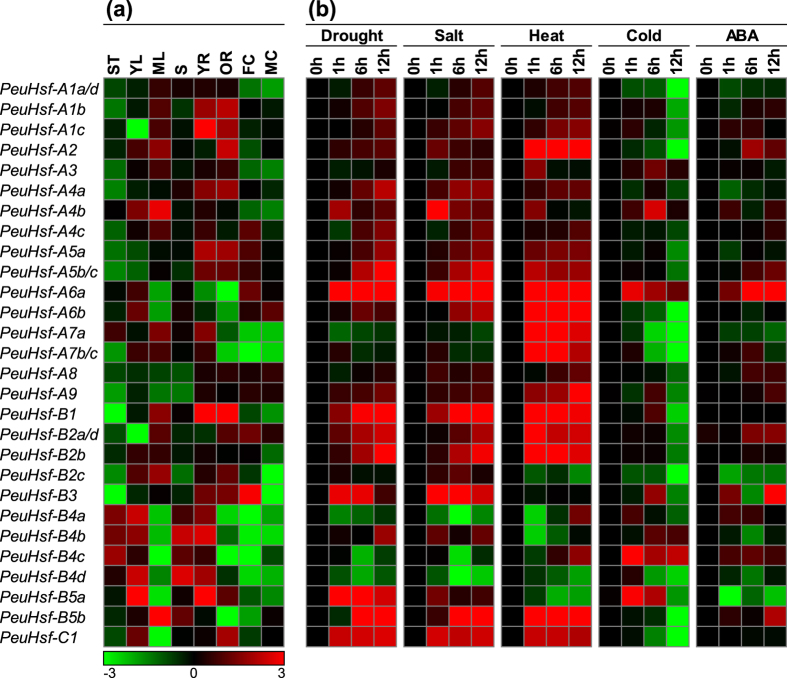
Figure 6.
Expression patterns of PeuHsf genes across different tissues (a) and under various abiotic stresses (b) using qRT-PCR. (a) The expression of PeuHsfs in shoot tip (ST), young leaf (YL), mature leaf (ML), stem (S), young root (YR), old root (OR), female catkin (FC), and male catkin (MC) from P. euphratica. (b) The expression patterns of PeuHsfs after treated for 0, 1, 6, or 12 h under drought (25% PEG w/v), salt (300 mM NaCl), heat (42 °C), cold (4 °C), or 100 μM abscisic acid (ABA). To illustrate, the expression of PeuHsfs in different tissues were compared with the median value among these tissues. For different treatment, the expression of PeuHsfs in 1, 6, or 12 h were compared with the control in 0 h. The different colors correspond to log2 transformed value, green indicates down-regulation and red represents up-regulation. The expression patterns of orthologous Hsf genes in Arabidopsis across various tissues and under abiotic stresses were shown in Supplementary Fig. S4 and Supplementary Fig. S5. Primers used for qRT-PCR are listed in Supplementary Table S3.

