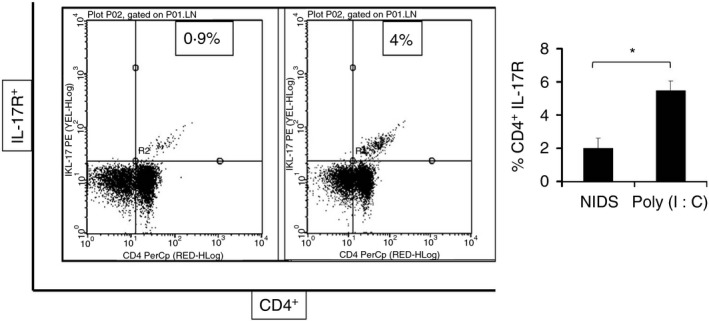
Figure 4.

Flow cytometric analysis (FACS, fluorescence activated cell sorter) of interleukin‐17 receptor (IL‐17R) expression by CD4+ T cells. Significantly higher percentages of CD4+ IL‐17R+ cells were measured from inguinal lymph node cells after a single i.m. administration of Poly (I:C) compared with Nutritive Immune‐enhancing Delivery System. The data are presented as mean values from eight mice per group, where the lymph nodes from two mice per group were pooled ± SEM (error bars) and P values are displayed as *P ≤ 0·05, **P < 0·01 and ***P < 0·001.
