
Figure 7.
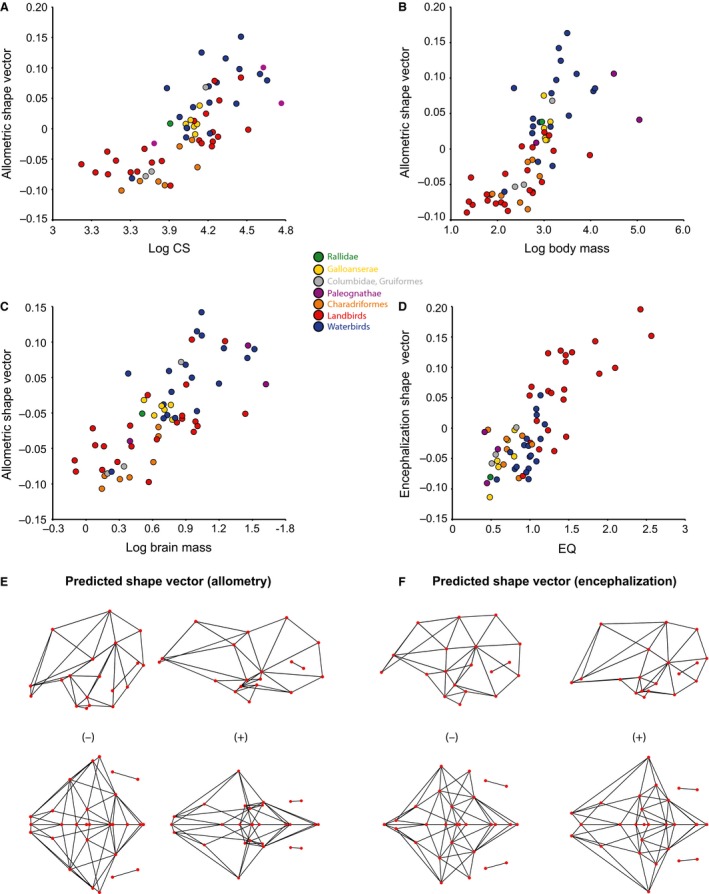
Multivariate regression of endocranial shape onto (A) log CS; (B) log body mass; (C) log brain mass; (D) EQs. The shape vectors represent an axis that maximizes the correlation between the multivariate shape data and respective size variable. All size variables (A–C) predict equivalent allometric shape changes as exemplified by relationship with log CS (E), and EQ (F) also predicts similar changes.