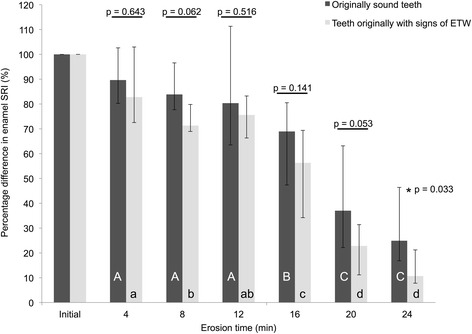
Fig. 2.

Median rSRI of originally sound teeth (black) and teeth that originally presented ETW (gray). Dispersion bars represent interquartile range. Different upper case letters represent differences between erosion times for originally Sound teeth, and different lower case letters represent differences between erosion times for teeth originally with ETW. P-values represent between-group differences (or lack thereof) at each time-point. For all analyses, no corrections for multiple testing were applied due to the explorative nature of the study
