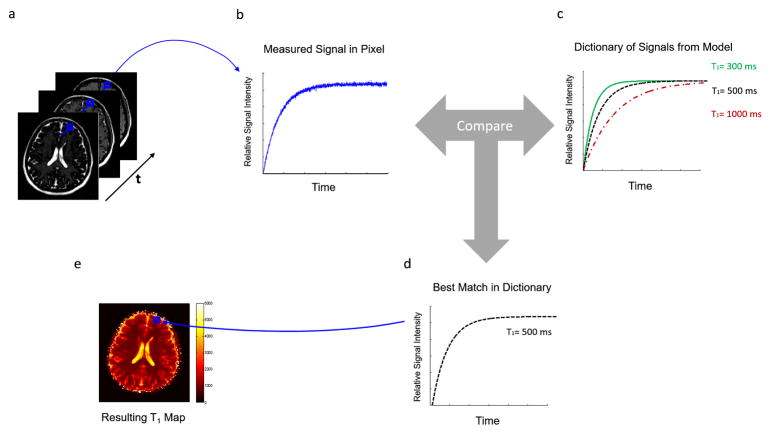
Figure 8.
(a) From a set of rapidly collected undersampled T1-weighted images, one pixel is selected and examined through time (b). With a knowledge of the underlying physics, a model can be used to calculate all possible signal timecourses for different values of T1. In this case, the dictionary consists of signals which could arise from T1 values of 300ms, 500ms, or 1000ms. The actually measured signal is then compared to the signals in the dictionary to find the closest match (d), in this case, the curve for T1=500ms. (e) The value of 500ms is then assigned as the T1 value for this pixel. The process is repeated for every pixel of interest to produce a T1 map.

