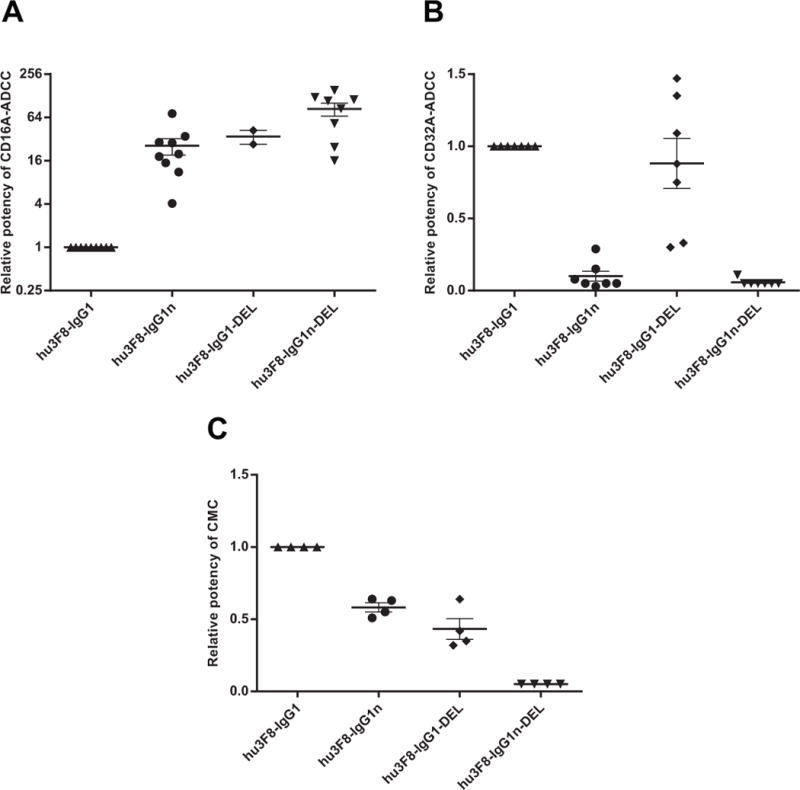
Figure 2. Potency of ADCC and CMC relative to hu3F8-IgG1.

Dot plots shown the relative potency (EC50 for IgG1/EC50 for IgG1 variants for each cell line) of ADCC for CD16A(158V) (A) and CD32A(131H) (B); and CMC for human serum (C). E:T = 20:1 for ADCC. Each dot represents one cell line. At least two different cell lines were assayed for each IgG1 variants. Bars denote Mean ± SEM. Relative potency below detection level was assigned as ≤ 0.05.
