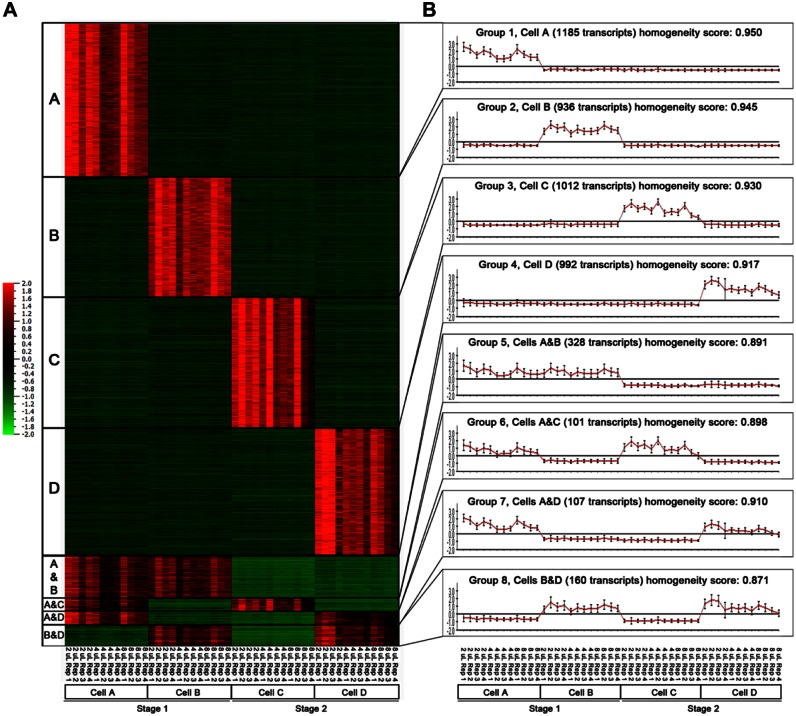
Figure 5.
Global single-cell gene expression analysis by RNA-seq. (A) Heatmap displaying differentially expressed genes (4821 genes, adjusted p < 0.00001, absolute log2 fold-change >4, maximum count >20) between cells A, B, C, and D, clustered using CLICK. (B) Graphs displaying the mean expression values for the transcripts in each CLICK cluster in each library. All replicate libraries for each cell were included in these analyses.

