Figure 7.
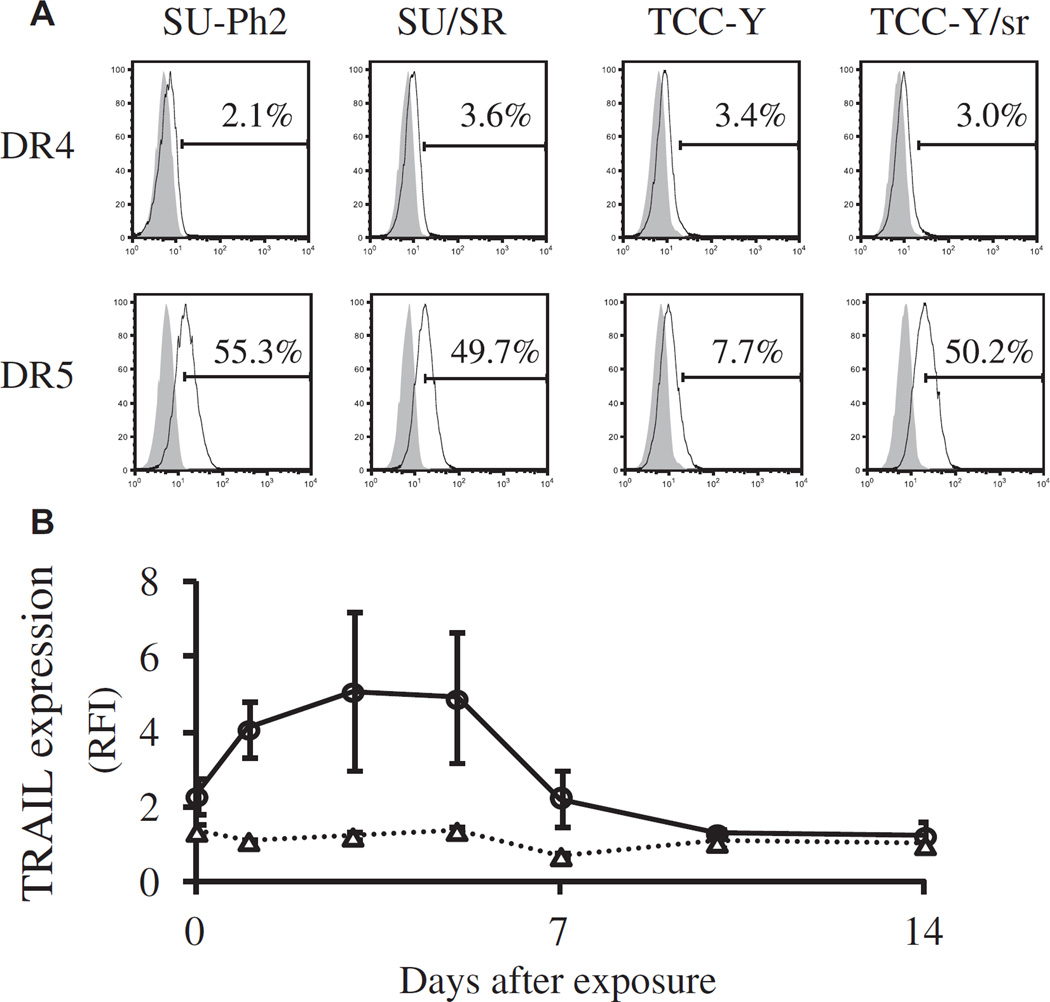
Expression of TRAIL and TRAIL receptors. (A) Expression of death receptors DR4 and DR5 on four Ph+ALL cell lines were determined by flow cytometry. We used two pairs of parent and daughter cell lines in which the daughters had acquired T315I mutations after culture in imatinib (SU-Ph2 and SU/SR; TCC-Y and TCC-Y/sr). (B) Change of TRAIL expression on CAR T cells compared with mock T cells after antigen stimulation with Ph+ALL. CAR T cells were co-cultured with SU/SR cells at an E:T ratio of 1:5. Expression of TRAIL on generated mock T cells and CAR T cells was determined by means of flow cytometry, with the use of anti–CD253 (TRAIL)-PE mAbs and anti–CD3-APC mAbs. The change of TRAIL expression is shown as RFI, determined by calculating the ratio of mean fluorescence intensity for specific staining to that for control staining. Open triangles (△) and open circles (○) indicate the RFI of TRAIL expression in mock T cells and CAR T cells, respectively. Data are presented as mean ± standard deviation of experiments from three donors.

