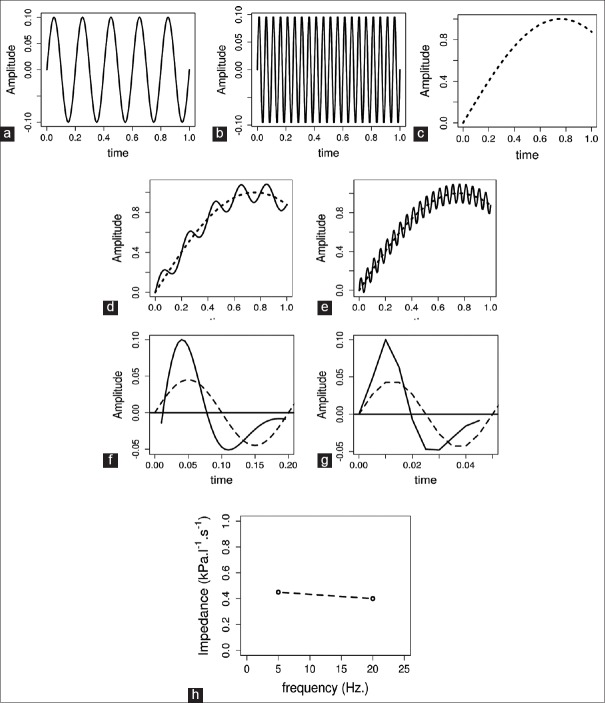
Figure 2.
Elucidation of Impulse oscillometry methodology. Sine waves at 5 Hz (a) and at 20 Hz (b). Flow recording of normal tidal breathing (c). Flow recording when tidal breathing is superimposed by 5 Hz waves (d) and 20 Hz waves (e). (f-g) show simulated change in flow (solid line) when a pressure wave (dashed line) with frequency 5 Hz (f) or 20 Hz (g) is applied

