Figure 3.

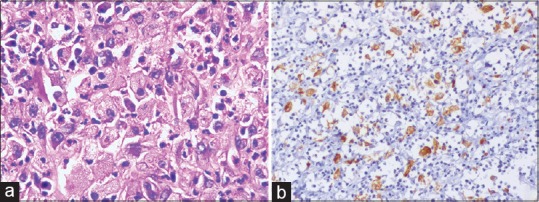
(a) Section of kidney lesion shows lymphocytes and plasma cells (H and E x200) (b) Foam cells showing CD68 positivity (x200)

(a) Section of kidney lesion shows lymphocytes and plasma cells (H and E x200) (b) Foam cells showing CD68 positivity (x200)