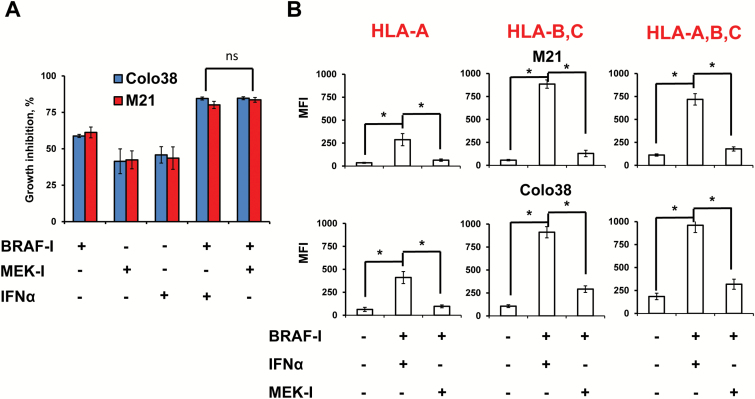
Figure 8.
Antiproliferative and immunomodulatory activity of BRAF-I in combination with IFNα or MEK-I in BRAFV600E melanoma cell lines. A) BRAFV600E melanoma cell lines Colo38 and M21 were seeded at the density of 2.5x10³ per well in a 96-well plate and incubated with vemurafenib (500nM) and/or IFNα-2b (10 000 IU/mL) and/or MEK-I trametenib (IC50). The IC50 of trametenib in M21 cells was 0.75nM while in Colo38 cells was 1.5nM (data not shown). Untreated cells were used as a control. Dimethyl sulfoxide (DMSO; vehicle of vemurafenib and trametenib) concentration was maintained at 0.02% in all wells. Following a 72-hour incubation at 37°C in a 5% CO2 atmosphere, growth inhibition was determined by 3-[4,5-dimethylthiazol-2-yl]-2,5 diphenyl tetrazolium bromide assay. Data are expressed as percentage of growth inhibition ± SD of treated cells as compared with untreated cells. Percent of growth inhibition and SD were calculated from three independent experiments; each of them was performed in triplicate. B) BRAFV600E melanoma cell lines Colo38 and M21 were seeded at the density of 1x10⁵ per well in a six-well plate and incubated with vemurafenib (500nM) and/or IFNα-2b (10 000 IU/mL) and/or MEK-I trametenib (IC50). Untreated cells were used as a control. DMSO (vehicle of vemurafenib) concentration was maintained at 0.02% in all wells. Following a 72-hour incubation at 37°C in a 5% CO2 atmosphere, cells were harvested and cell surface stained with the indicated HLA class I antigen–specific mAbs. mAb MK2-23 was used as a specificity control. Cell staining was detected by R-PE-conjugated F(ab’)2 fragment goat antimouse IgG. Data are expressed as mean fluorescence intensity ± SD of the results obtained in three independent experiments. *Indicates P < .001. All P values were calculated using the two-sided Student’s t test.

