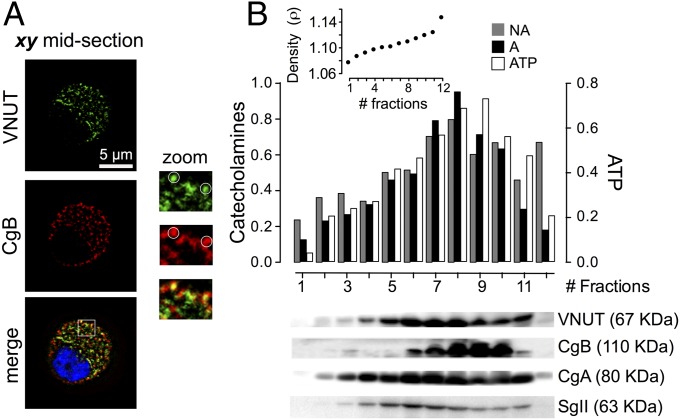
Fig. 1.
(A) Endogenous VNUT codistributes with secretory chromaffin vesicles. Typical confocal microscopy images showing the cellular distribution of endogenous VNUT and CgB. The merged image also shows the DAPI staining. The 3× zoomed images show the colocalization of VNUT and CgB in specific structures. Quantification was performed as described in Materials and Methods. (B) Normalized distribution of several components in chromaffin secretory vesicles. Twelve fractions of 450 µL (#1 lighter, #12 heavier) were obtained by density gradient sedimentation. (Upper) Quantification of noradrenaline (NA), adrenaline (A), and ATP. The bars show pooled data from three independent gradients, and a typical chromaffin SG proteins distribution, data from one representative experiment (Lower). The Inset shows the iodixanol density profile of each fraction taken from a parallel ultracentrifuge tube. CgA, chromogranin A; CgB, chromogranin B; SgII, secretogranin II.

