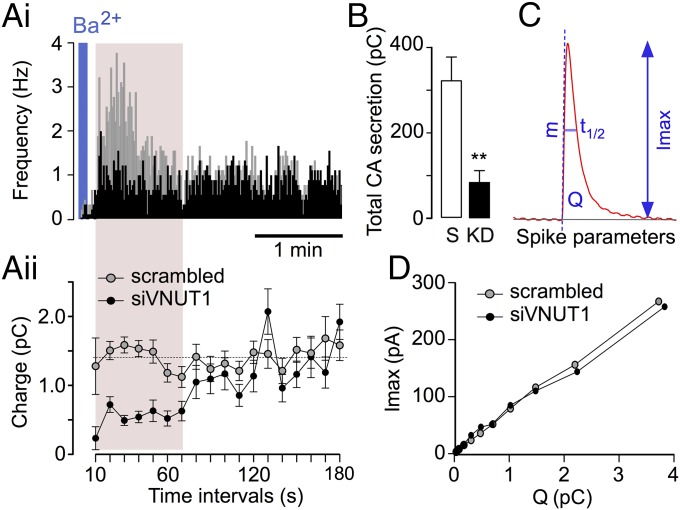
Fig. 6.
Quantum catecholamine size from VNUT-KD SGs. (A, i) Spike-frequency analysis of isolated cells nucleofected with the scrambled (gray traces) or siVNUT oligonucleotides (black traces) and stimulated for 5 s with 5 mM BaCl2. Each spike represents the catecholamine released from a single vesicle. Frequency bins are the average number of spikes in 1 s. (A, ii) Quantum size of the exocytotic events recorded in 10-s bins over 3-min intervals. Each open circle (scrambled) and solid circle (siVNUT1) represents the average charge (in picocoulombs, nine cells each). (B) Total secretion (mean ± SEM) comparing the control (scrambled, S) and siVNUT1 (KD). The cumulative charges were measured for 3 min after stimulation and they are expressed as picocoulombs. **P < 0.01, Student’s t test. (C) Parameters obtained from each secretory spike: Imax, maximum oxidation current; t1/2, spike width at the half-height; Q, net catecholamine charge; m, ascending slope of the spike. (D) Spike amplitude (Imax) versus quantum size (Q) of secretory spikes from siVNUT and control nucleofected cells: Mann–Whitney U test with the Bonferroni correction (the data are averaged from the experiment shown in Table 1).

