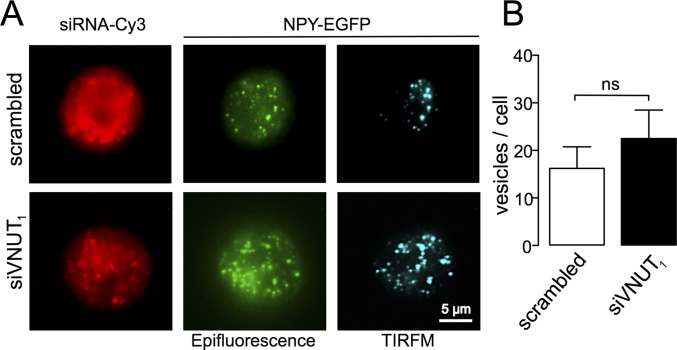
Fig. S3.
The NPY-EGFP expression remains unchanged in VNUT-KD cells. (A) Representative images of chromaffin cells obtained with conventional fluorescence showing siRNA oligonucleotides labeled with Cy3 and newly synthesized vesicles expressing NPY-EGFP (green). Newly formed vesicles closest to the membrane can be observed by total internal reflection fluorescence microscopy (TIRFM) (blue spots). (B) Pooled data from TIRFM images showing no differences in the number of vesicles expressing NPY-EGFP in control (scrambled) and siVNUT1-treated cells. The bars represent the means ± SD (n = 5). Values were compared using Mann–Whitney U test P = 0.458.

