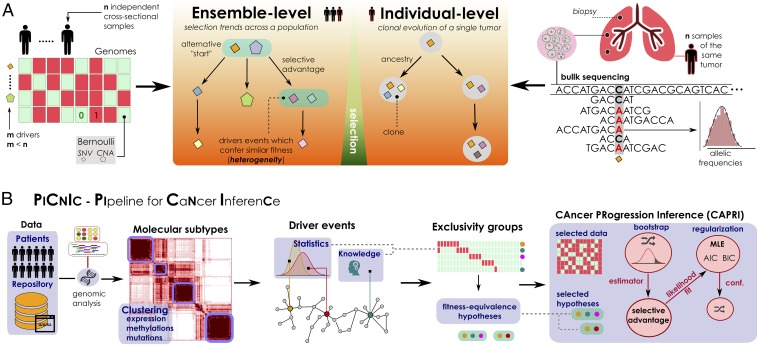
Fig. 1.
(A) Problem statement. (A, Left) Inference of ensemble-level cancer progression models from a cohort of n independent patients (cross-sectional). By examining a list of somatic mutations or CNAs per patient (0/1 variables) we infer a probabilistic graphical model of the temporal ordering of fixation and accumulation of such alterations in the input cohort. Sample size and tumor heterogeneity complicate the problem of extracting population-level trends, because this requires accounting for patients’ specificities such as multiple starting events. (A, Right) For an individual tumor, its clonal phylogeny and prevalence is usually inferred from multiple biopsies or single-cell sequencing data. Phylogeny-tree reconstruction from an underlying statistical model of reads coverage or depths estimates alterations’ prevalence in each clone, as well as ancestry relations. This problem is mostly worsened by the high intratumor heterogeneity and sequencing issues. (B) The PiCnIc pipeline for ensemble-level inference includes several sequential steps to reduce tumor heterogeneity, before applying the CAPRI (40) algorithm. Available mutation, expression, or methylation data are first used to stratify patients into distinct tumor molecular subtypes, usually by exploiting clustering tools. Then, subtype-specific alterations driving cancer initiation and progression are identified with statistical tools and on the basis of prior knowledge. Next is the identification of the fitness-equivalent groups of mutually exclusive alterations across the input population, again done with computational tools or biological priors. Finally, CAPRI processes a set of relevant alterations within such groups. Via bootstrap and hypothesis testing, CAPRI extracts a set of “selective advantage relations” among them, which is eventually narrowed down via maximum likelihood estimation with regularization (with various scores). The ensemble-level progression model is obtained by combining such relations in a graph, and its confidence is assessed via various bootstrap and cross-validation techniques.

