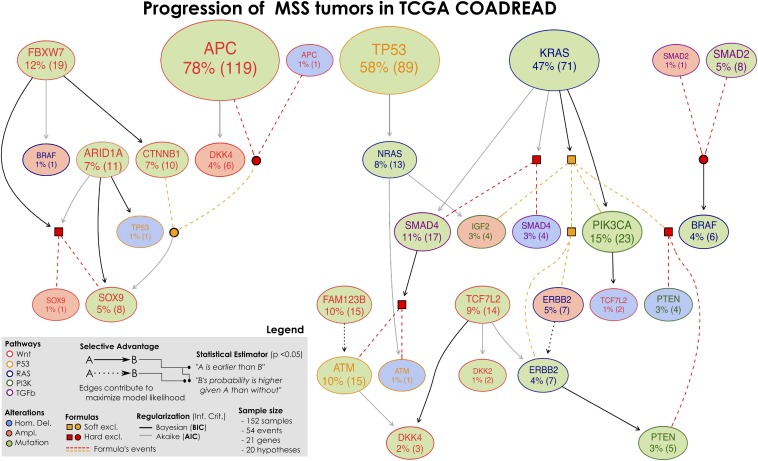
Fig. 4.
Selective advantage relations inferred by CAPRI constitute MSS progression; the input dataset is given in SI Appendix, Figs. S4 and S5. Formulas written on groups of exclusive alterations (e.g., SOX9 amplifications and mutations) are displayed in expanded form; their events are connected by dashed lines with colors representing the type of exclusivity (red for hard, orange for soft). Logical connectives are squared when the formula is selected and circular when the formula selects for a downstream node. For this model of MSS tumors in COADREAD we find strong statistical support for many edges (P values, bootstrap scores, and cross-validation statistics shown in the SI Appendix), as well as the overall model. This model captures both current knowledge about CRC progression—for example, selection of alterations in PI3K genes by the KRAS mutations (directed or via the MEMO group, with BIC)—as well as novel interesting testable hypotheses [e.g., selection of SOX9 alterations by FBXW7 mutations (with BIC)].

