Fig. 4.
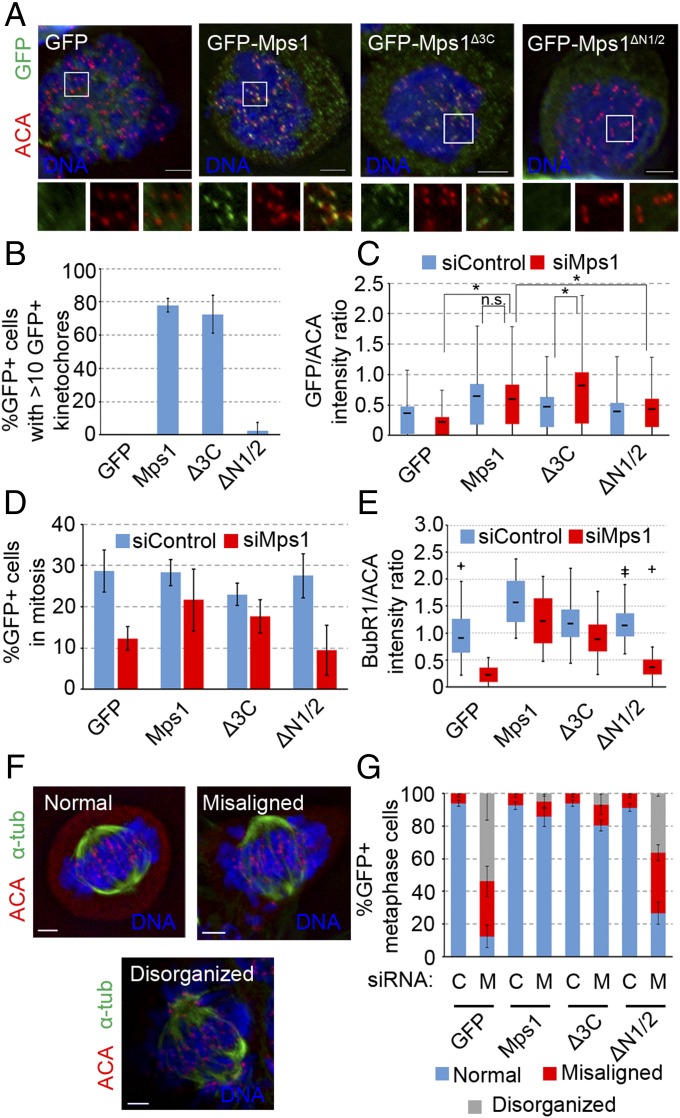
Mps1 localization to the centrosome is dispensable for its kinetochore functions. (A) Representative images of HeLa cells expressing the indicated constructs treated with nocodazole for 16 h showing DNA (Hoechst, blue), GFP (green), autoimmune anticentromere antibody (ACA; red). (B) Percentage of cells from A in which a majority of kinetochores are GFP+, as judged by colocalization of GFP and ACA on at least 10 of 20 randomly chosen kinetochores; mean ± SD of n = 3 independent experiments of n = 100 cells for each experiment. (C) Box and whisker plot of GFP intensity normalized to that of ACA (GFP/ACA) at kinetochores. Box indicates 50% of intensity measurements from the 25th to the 75th percentile of n = 300 kinetochores (20 kinetochores from each of five nocodazole-treated cells from n = 3 independent experiments), and whiskers extend up and down to the statistical maximum and minimum. Line in box indicates the mean of the data set. *P ≤ 0.05 from Student’s t test (two-tailed), n.s., not significant (P > 0.05). (D) Percentage of GFP+ cells with condensed mitotic chromatin after 16-h nocodazole treatment; mean ± SD of n = 3 independent experiments of n = 200 cells for each experiment. (E) Box and whisker plot of BubR1 intensity normalized to that of ACA (BubR1/ACA) at kinetochores as in C, with n = 30 kinetochores from n = 3 independent experiments. +, statistical outliers (greater than 1.5× the interquartile range). (F) Representative images of metaphase phenotypes: DNA (blue), α-tubulin (green), centromeres/kinetochores (ACA, red). (G) Percentage of GFP+ cells with indicated metaphase phenotype after release from double thymidine block into MG132; mean ± SD of n = 3 independent experiments of n ≥ 35 cells for each experiment. (Scale bars, 5 µm.)

