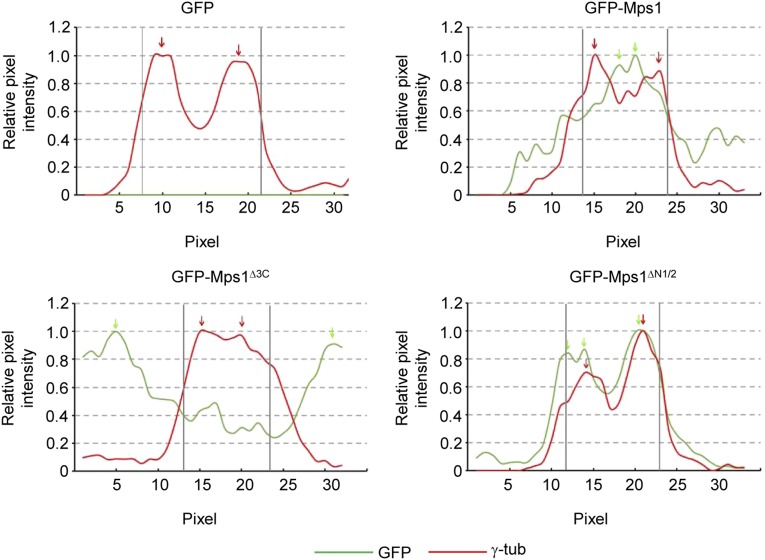
Fig. S3.
The third TPR and capping helix are necessary for Mps1 targeting to the centrosome. Line scan intensity profiles of indicated images from Fig. 2B. As previously described (18), the pixel intensity of both GFP and γ-tubulin is measured along a 5-µm line drawn through the centrosomal γ-tubulin. The reported intensities are normalized to the maximum intensity along the line. GFP is scored as centrosomally localized in a cell if all GFP peaks within 80% of the maximal GFP signal along the line lie within two pixels of the γ-tubulin peaks along the line. Green and red arrows indicate peaks of intensity above 80% of the maximum intensity measured for GFP and γ-tubulin, respectively. Vertical gray bars indicate two-pixel intervals for the γ-tubulin peaks.

