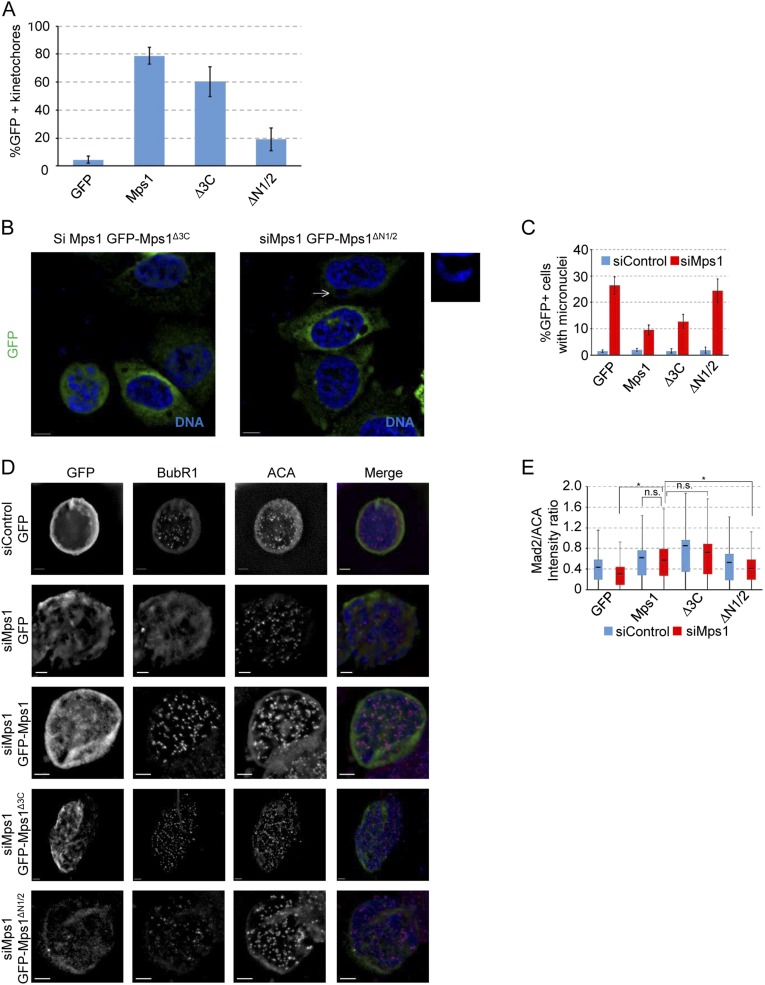
Fig. S6.
Noncentrosomal Mps1 rescues mitotic phenotypes associated with loss of Mps1. (A) Percentage of GFP+ kinetochores, presented as the mean ± SD of n = 3 independent experiments of n = 100 kinetochores, or 20 kinetochores from five cells in each experiment. (B) Representative images of HeLa cells transfected with the indicated constructs and treated with nocodazole for 16 h, showing DNA (blue) and GFP (green). Arrow indicates a micronucleus magnified in smaller panel. (Scale bar, 10 µm.) (C) Percentage GFP+ interphase cells with micronuclei after 16 h nocodazole treatment. Presented is the mean ± SD of n = 3 independent experiments of n = 100 cells for each experiment. (D) Representative images of HeLa cells transfected with the indicated constructs and treated with nocodazole overnight. From left to right by column shown in grayscale: GFP, BubR1, ACA, and a merged image showing DNA (blue), GFP (green), BubR1 (red), and ACA (magenta). (Scale bar, 5 µm.) (E) Box and whisker plot of Mad2 intensity normalized to that of ACA (Mad2/ACA) at kinetochores. Box and whisker plots represent the same statistical data points as in Fig. 4C. *P ≤ 0.05 from Student’s t test (two-tailed), n.s., not significant (P > 0.05).

