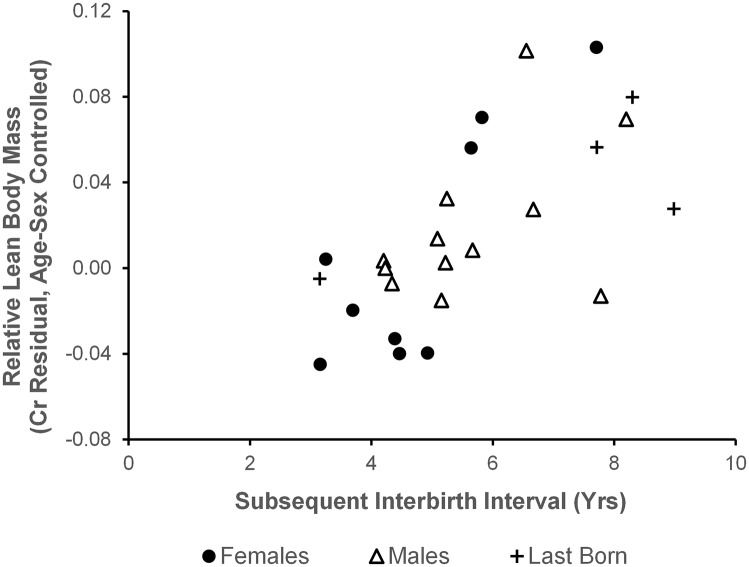
Fig. 3.
Association between subsequent birth interval and estimated lean body mass of juveniles (n = 21; r = 0.662; P = 0.001). Points indicate the mean creatinine residuals, corrected for age and sex, for each juvenile chimpanzee. Positive values indicate that an individual was larger than expected for age/sex. Last-born offspring (crosses, n = 4) are plotted for comparison.

