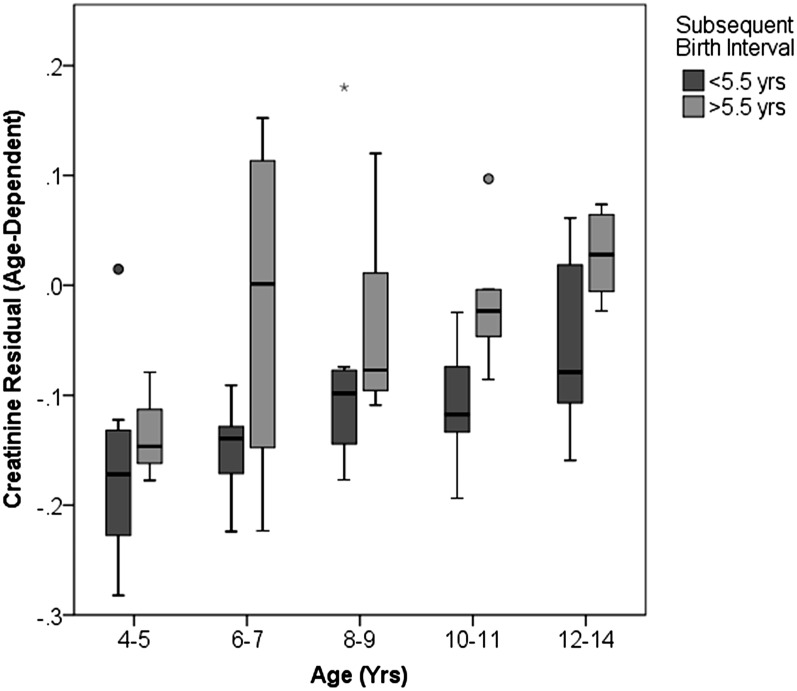
Fig. 4.
Effects of interbirth interval on juvenile growth across the juvenile period, depicting uncorrected residuals to show changes with age. Boxplots indicate median and interquartile range across individuals (n = 3–12 individuals per box). Most subjects were represented in more than one age category.

