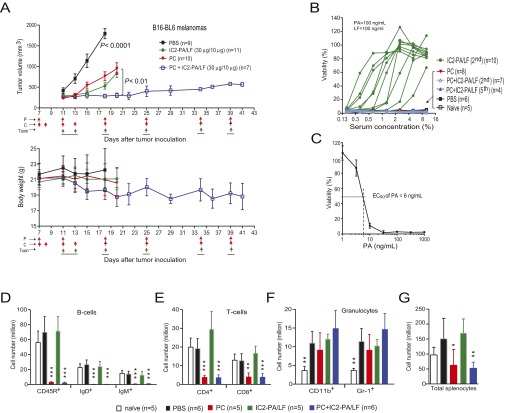
Fig. S8.
Remarkable antitumor efficacy of the combined therapy of the engineered anthrax toxin and pentostatin plus cyclophosphamide regimen. (A) B16-BL6 melanoma-bearing immunocompetent C57BL/6J mice were treated intraperitoneally with PBS, IC2-PA/LF (30 µg/10 µg) (30 µg of IC2-PA = 15 µg of PA-L1-I207R plus 15 µg of PA-U2-R200A), PC regimen (20 µg of pentostatin and 1 mg of cyclophosphamide), combined IC2-PA/LF and PC regimen. Schedules for the treatments with PC regimen and the toxin are indicated by the arrows. Tumor volumes (means ± SE) and body weights of the mice (means ± SD) were monitored. Note that PC regimen alone had significant antitumor activity. One-way ANOVA for tumor size differences: PBS vs. all other groups, P < 0.0001; PC plus IC2-PA/LF vs. PC or IC2-PA/LF, P < 0.01. (B) RAW264.7 cells were incubated with PA/LF (100 ng/mL each) for 5 h in the presence of various dilutions of sera obtained from the representative mice in A after the second or fifth (final) round of therapy. Cell viabilities were determined by MTT assay as described in Materials and Methods. Note that no neutralizing antibodies were detected in all of the cases from PC, as well as the combined treatment groups. (C) RAW264.7 cells were incubated with various concentrations of PA in the presence of 100 ng/mL LF for 5 h, and cell viabilities were determined as in B. The EC50 (effective concentration required to kill 50% of the cells) of PA is 6 ng/mL in the presence of 100 ng/mL LF. (D–G) Effects of pentostatin plus cyclophosphamide regimen on immune cells. Splenocytes were isolated and counted from naive mice and the B16-BL6 melanoma-bearing mice after the second cycle of therapy with PBS, PC, IC2-PA/LF, or the combined PC and the toxin as shown in A and were subsequently stained with various fluorochrome-conjugated mAbs: anti-CD45R, anti-CD4, anti-CD8, anti-CD11b, and anti–Gr-1, anti-IgD, and anti-IgM. The cells were analyzed using a BD FACSCanto Flow Cytometer. Cell numbers positive for B-cell markers (D), T-cell markers (E), and granulocyte markers (F) were obtained by the following formula: total splenocytes × percentage of positive cells. B-cell markers were CD45R, IgD, and IgM; T-cell markers were CD4 and CD8; markers for granulocytes were CD11b and Gr-1. Data are shown as mean ± SD. (G) Total splenocyte counts of the mice analyzed. One-way ANOVA in D, E, and G, PBS vs. treated groups, *P < 0.05, **P < 0.01, ***P < 0.001.

