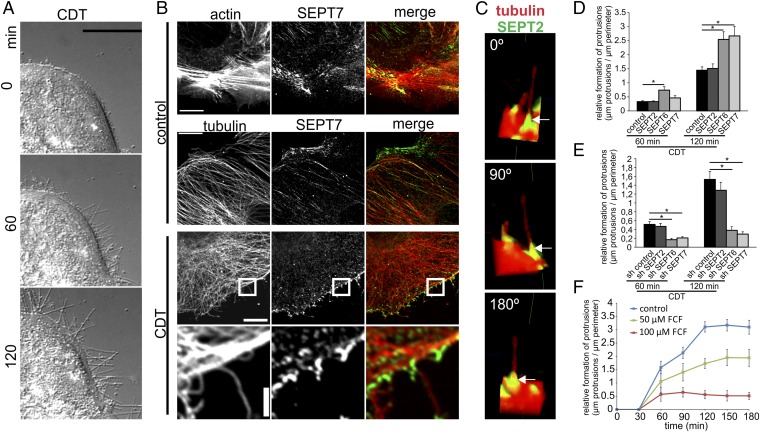
Fig. 1.
Membrane translocation of septins after CDT treatment and their role in protrusion formation. (A) Differential interference contrast (DIC) time-lapse microscopy of Caco-2 cells. Cells were treated with CDT (200 ng/mL CDTa and 400 ng/mL CDTb) for the indicated times. (Scale bar, 20 µm.) (B) Indirect immunofluorescence in Caco-2 cells of SEPT7 (green) with actin (red, TRITC-phalloidin) or of SEPT7 (green) and α-tubulin (red). Cells were treated with CDT (200 ng/mL CDTa and 400 ng/mL CDTb) for 90 min. (Scale bars: 10 µm; Insets, 2 µm.) (C) Indirect immunofluorescence in Caco-2 cells of SEPT2 and α-tubulin. Cells were treated with CDT as in B. Images are 3D reconstructions of apical protrusions from different angles. (D) Caco-2 cells were transfected with shRNA for SEPT2, SEPT6, and SEPT7, respectively. After 48 h, cells were treated as in A. The relative formation of protrusions (“µm protrusions/µm cell perimeter”) was quantified. Data are ± SEM, cells are ≥56, and n ≥ 3. (E) Caco-2 cells were transfected with expression plasmids encoding SEPT2, SEPT6, and SEPT7, respectively, fused to GFP. Relative formation of protrusions was quantified. Data are ± SEM, cells are ≥75, and n ≥ 3. (F) Caco-2 cells were treated with 50 or 100 µM of FCF for 2.5 h. Subsequently, cells were treated with CDT (as in A).The relative formation of protrusions was quantified over time. Data are ± SEM, fields of view are ≥20, and n = 3.

