Fig. 3.
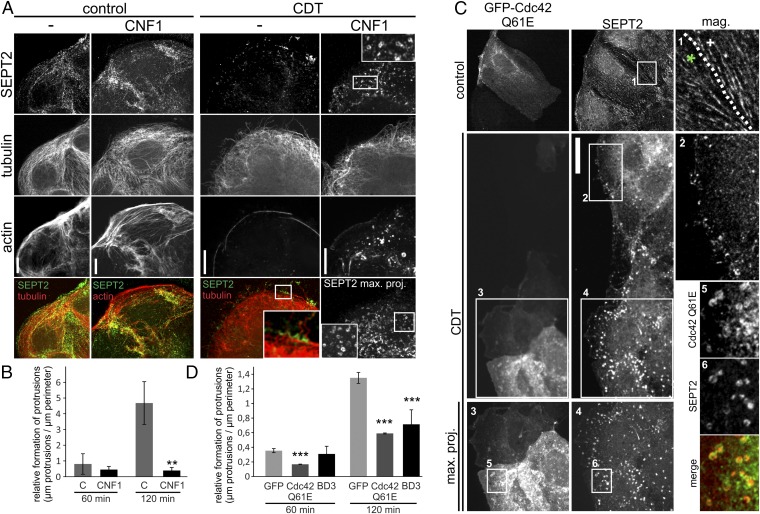
Influence of Cdc42 on septin accumulation. (A) Caco-2 cells were pretreated with 150 ng/mL CNF1 for 3 h to activate Rho-GTPases. Cells were subsequently treated with CDT (200 ng/mL CDTa and 400 ng/mL CDTb) for 1.5 h. Cells were stained for SEPT2, α-tubulin, and actin. To visualize all septin rings in CNF1 plus CDT-treated cells, confocal stacks were projected into one plane. Insets show chevron-like structures at the base of protrusions in CDT-treated cells. In CNF1- and CDT-treated cells, Insets show septin-ring formation. (Scale bar, 10 µm.) (B) Caco-2 cells were treated as in A. The relative formation of protrusions (“µm protrusions/µm cell perimeter”) was quantified after 60 and 120 min of CDT intoxication. Data are ± SEM, fields of view are ≥7, and n = 3. (C) Caco-2 cells were transfected with dominant active Cdc42 (Q61E) for 24 h. Cells were treated with CDT as in A. Inset in “control” shows septin filaments in transfected (green asterisk) and nontransfected (white cross) cells. To visualize all septin rings in transfected CDT-treated cells, confocal stacks were projected into one plane. Insets show cortical septin structures in CDT-treated cells. In transfected CDT-treated cells, Insets show septin ring formation. Septin rings colocalize with dominant active Cdc42. (Scale bar, 10 µm.) (D) Caco-2 cells were treated as in C. Control cells were transfected with GFP only. Cells were also transfected with the BD3 domain of Borg2 fused to GFP. Relative formation of protrusions was quantified after 60 and 120 min. Data are ± SEM, transfected cells are ≥13, and n = 3.

