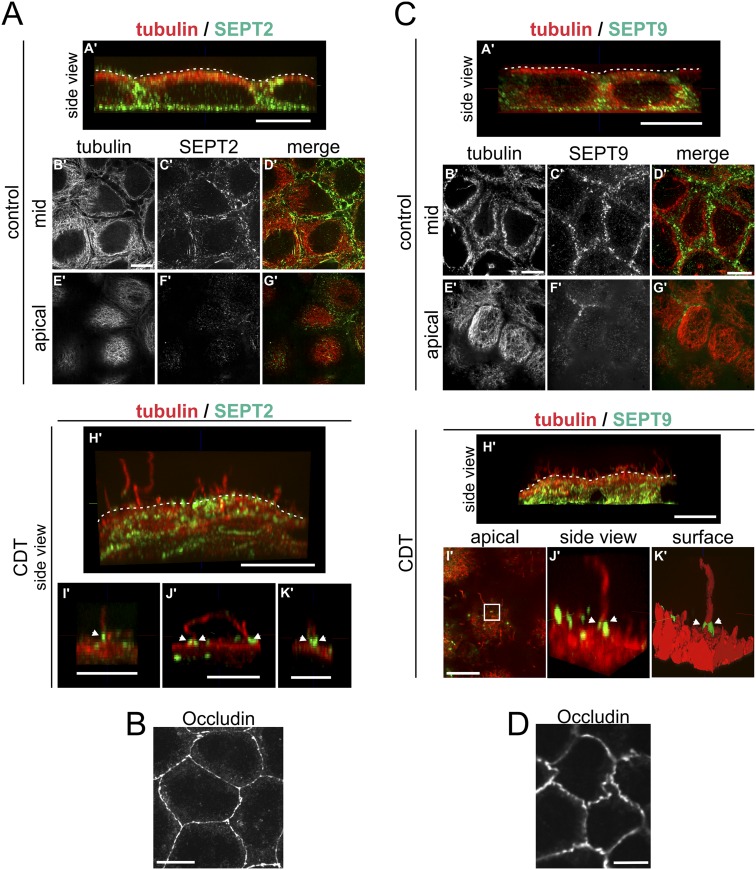
Fig. S3.
Membrane translocation of SEPT2 and SEPT9 after CDT treatment in polarized cells. (A) Polarized Caco-2 cells were stained by indirect immunofluorescence for SEPT2 (green) together with α-tubulin (red). Cells were treated with CDT (200 ng/mL CDTa and 400 ng/mL CDTb) for 90 min. The figure shows images representing side views of 3D-reconstructed confocal stacks (side view: A', H', I', J', K'). Additionally, single planes of confocal stacks originally covering the cell from top to bottom are shown. The single planes are from the cell mid (mid: B', C', D') or from the apical cell surface (apical: E', F', G'). SEPT2 was present at the base of the cell (A') and the cell periphery (A'–D'). Almost no SEPT2 was detected at the apical surface of the cells (E'–G'). After CDT treatment, cells formed protrusions at the apical cell surface (H'). SEPT2 formed apical clusters at the base of protrusions (I', J', K', white arrowheads). (Scale bars, 10 μm in A'–H'; 5 μm in I', J', K'). (B) As in A, cells were cultured for the same time at the same density. Tight junctions were stained by indirect immunofluorescence for occludin as a marker for differentiation and polarization. (Scale bar, 10 μm.) (C) Polarized Caco-2 cells were stained by indirect immunofluorescence for SEPT9 (green) together with α-tubulin (red). Cells were treated with CDT (200 ng/mL CDTa and 400 ng/mL CDTb) for 90 min. The figure shows images representing side views of 3D-reconstructed confocal stacks (side view: A', H', J') and a 3-D surface reconstruction (surface: K'). Additionally, single planes of confocal stacks originally covering the cell from top to bottom are shown. The single planes are from the cell mid (mid: B', C', D') or from the apical cell surface (apical: E', F', G', I'). In subconfluent cells, SEPT9 staining of cells was weak. In polarized cells, SEPT9 was present at the base and the cell periphery (A'–D'). Almost no SEPT9 was detected at the apical surface of the cells (E', F', G'). After CDT treatment, cells formed protrusions at the apical surface (H'), SEPT9 formed apical clusters at the base of protrusions (I', J', K', white arrowheads, J' and K' are reconstructions of the white box in I'). (Scale bars, 10 μm.) (D) As in C, cells were cultured for the same time at the same density. Tight junctions were stained by indirect immunofluorescence for occludin as a marker for differentiation and polarization. (Scale bar, 10 μm.)

