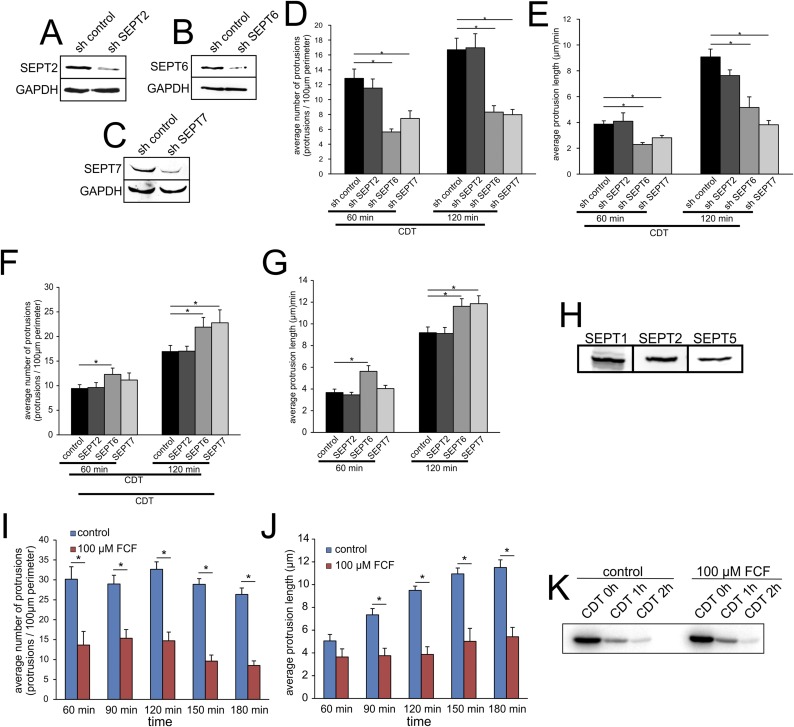
Fig. S7.
The role of septins in protrusion formation. (A) Western blot of HeLa cells after SEPT2 knockdown by shRNA. (B) Western blot of HeLa cells after SEPT6 knockdown by shRNA. (C) Western blot of HeLa cells after SEPT2 knockdown by shRNA. (D) Quantification of average number of protrusions after 48 h of transfection with control shRNA and shRNA targeting SEPT2, SEPT6, or SEPT7. Cells were intoxicated with 200 ng/mL CDTa and 400 ng/mL CDTb to induce protrusion formation for the indicated times. Data are given ± SEM, cells are ≥56, and n ≥ 3. (E) Quantification of average protrusion length after 48 h of transfection with control shRNA and shRNA targeting SEPT2, SEPT6, or SEPT7. Cells were intoxicated with 200 ng/mL CDTa and 400 ng/mL CDTb to induce protrusion formation for the indicated times. Data are given ± SEM, cells are ≥56, and n ≥ 3. (F) Quantification of average number of protrusions after 24 h overexpression of GFP, GFP-SEPT2, SEPT6, or SEPT7. Cells were intoxicated with 200 ng/mL CDTa and 400 ng/mL CDTb to induce protrusion formation for the indicated times. Data are given ± SEM, cells are ≥75, and n ≥ 3. (G) Quantification of average protrusion length after 24 h overexpression of GFP, GFP-SEPT2, SEPT6, or SEPT7. Cells were intoxicated with 200 ng/mL CDTa and 400 ng/mL CDTb to induce protrusion formation for the indicated times. Data are given ± SEM, cells are ≥75, and n ≥ 3. (H) Representative Western blot of Caco-2 cell lysate with detection for SEPT1, SEPT2, and SEPT5. (I) Quantification of average number of protrusions over time with or without FCF pretreatment. Cells were intoxicated with 200 ng/mL CDTa and 400 ng/mL CDTb to induce protrusion formation. Data are given ± SEM, fields of view are ≥20, and n = 3. (J) Quantification of average length of protrusions over time with or without FCF pretreatment. Cells were intoxicated with 200 ng/mL CDTa and 400 ng/mL CDTb to induce protrusion formation. Data are given ± SEM, fields of view are ≥20, and n = 3. (K) Caco-2 cells were pretreated for 2.5 h with FCF. Cells were intoxicated with 200 ng/mL CDTa and 400 ng/mL CDTb for the indicated times. The autoradiogram shows the ongoing ADP ribosylation of actin in the presence or absence of FCF.

