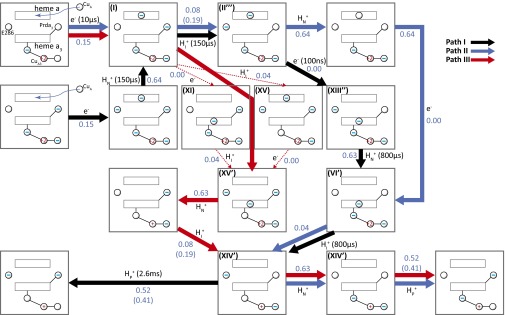
Fig. 3.
Three different possible PT/ET paths consistent with the electrometric experiment in ref. 33. HN+, HP, and HI+ represent, respectively, the PT from the N side, the PT toward the P side, and the internal PT. e– represents ET. The spheres with the charges represent the charge state of the corresponding group. The – in spheres represents the deprotonated state for E286/Prda3 and the reduced state for heme a/a3, respectively. For example, in state I, the oxidation state of CuA3 is +2, and heme a is reduced. The numbers in the diagram represent the measured/calculated voltage generation (electrogenicity) associated with the corresponding PT or ET reactions. The – near Cu designates the charge on the ligands of the Cu. The Roman numeral that designate different states follow the notation of ref. 16. The reaction times are taken from ref. 33, and the time scale from the E286 to Prda3 (or E286 to BNC) transfer and the N side to E286 transfer cannot be separate. Path I (black arrows) is the path that corresponds to the proposal of ref. 33. The path starts with an ET to heme a, PT from the N side to E286, PT from E286 to the PLS, ET to heme a3, PT from E286 to the BNC, and PT to the P side. Paths II (colored in blue) and III (colored in red) are based on the options explored in ref. 16 and subsequent estimates (e.g., ref. 41). Path II starts with ET to heme a, PT to the PLS, PT from the N side to E286, ET to heme a3, PT from E286 to the BNC, PT from N to E286, and PT to the P side. Path III starts with an ET to heme a, ET to heme a3, and PT to the BNC (with two alternative paths), PT from the N side, PT to the PLS, and the same two last steps as in path II. The numbers in parentheses correspond to the fraction of membrane potentials when D412 is served as the PLS. The pathways along path III represented by thin red lines represent options that cannot be resolved at present.

