Fig. 3.
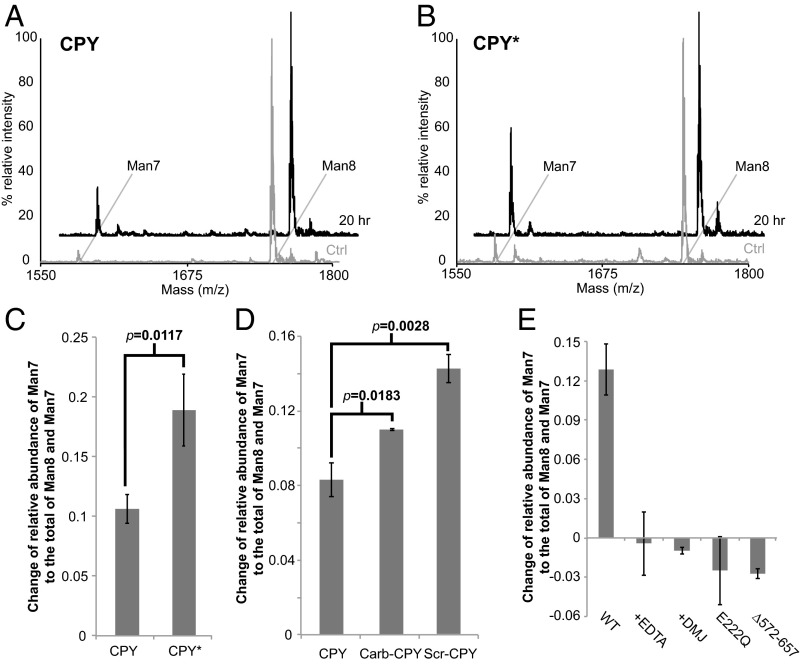
Htm1p–Pdi1p preferentially demannosylates CPY* and nonnative CPY variants. (A and B) Representative glycan profiles of CPY (A) and CPY* (B) before and after 20-h incubation with Htm1p–Pdi1p. CPY or CPY* (2 µM) was incubated with 0.1 µM Htm1p–Pdi1p at 30 °C for 20 h and then was separated from Htm1–Pdi1p by SDS/PAGE for subsequent in-gel glycan release and MALDI-TOF MS analysis. (C) Htm1p–Pdi1p generates more Man7 on CPY* than on CPY after reaction. The mannosidase activity is measured by the change in the relative abundance of Man7 on CPY and CPY* after 20-h incubation with Htm1p–Pdi1p. Shown are the mean values ± one SD from an experiment performed in triplicate. The P value was calculated by unpaired t test. (D) Htm1p–Pdi1p generated more Man7 on Carb-CPY and Scr-CPY than on CPY. Shown are the mean values ± one SD from an experiment performed in triplicate. The P value was calculated by unpaired t test. (E) The mannosidase activity of Htm1p–Pdi1p against CPY* was inhibited by EDTA (+EDTA), 1-deoxymannojirimicin (+DMJ), and mutations including E222Q and ∆572–657. Quantification was carried out as in C. Shown are the mean values ± one SD from an experiment performed in triplicate.

