Fig. 2.
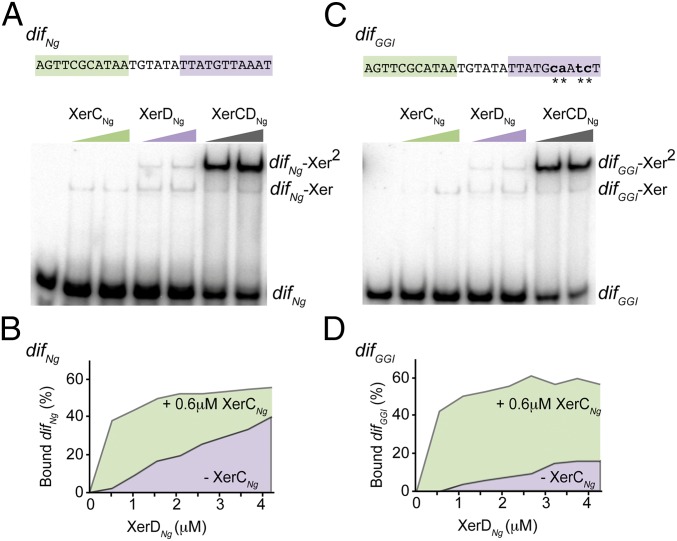
XerCNg and XerDNg bind to difNg and difGGI. EMSA experiment showing the interaction between an increasing concentration of XerCNg (0.4 and 0.6 μM) and XerDNg (1.4 and 1.8 μM) and a 28-bp DNA fragment containing either difNg (A) or difGGI (C). The color code used is the same as in Fig. 1. Unbound DNA (dif), complexes with one recombinase bound (dif–Xer), and complexes with two recombinases bound (dif–Xer2) are represented. In C, substituted positions in difGGI are represented as lowercase characters and highlighted by stars. (B and D) Titration experiment of difNg (B) or difGGI (D) by XerDNg. The experiment was done in presence (underlined with green) or in absence (underlined with purple) of XerCNg (see also Fig. S1E).

