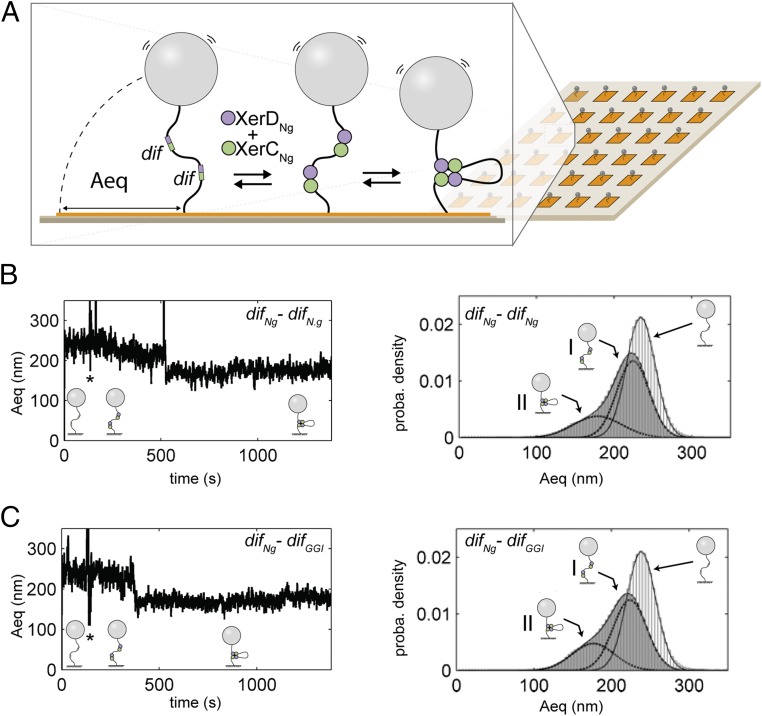
Fig. 3.
HT-TPM measurement of recombination complex formation. (A) A glass coverslip (pale brown) is coated with neutravidin (orange). A DNA molecule is attached to this surface by biotin bound to one of its 5′ end. A latex bead coated with antidigoxigenin is bound to the other extremity of the DNA carrying digoxigenin at its 5′ end. XerCNg and XerDNg (green and purple circles) bind dif sites (green and purple boxes) and the formation of a complex between two dif sites significantly decreases the amplitude of bead motion (Aeq). (B and C, Left) Typical traces [Aeq = f(time)] observed for DNA molecules containing either two difNg sites (B) or one difNg one difGGI sites (C). Stars (*) indicate the times of XerCDNg mix injection. Schemes of the inferred DNA structures of the DNA are shown underneath each trace. (Right) Probability distributions of Aeq before protein addition (light gray) and during the 20 min following XerCDNg addition (dark gray). The Gaussian fitting curves, used to characterize the different DNA subpopulations contributing to the Aeq distributions, are superimposed to the distributions as well as the schemes of the inferred DNA structures for each subpopulation (I refers to the first peak and II to the second).

