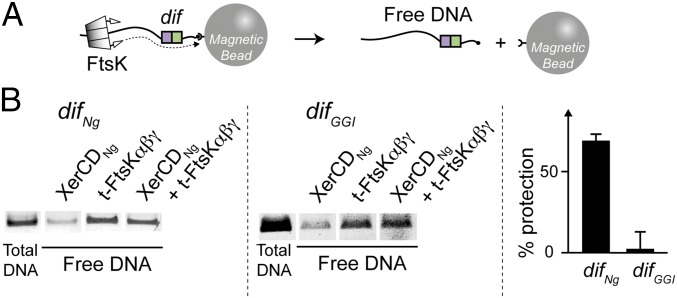
Fig. 6.
FtsK stoppage on XerCD/dif complexes. (A) Schematic of the translocation assay using a color code as in Fig. 1. The dotted line represents FtsK translocation, which releases the DNA from the bead (biotine/streptavidin link breakage), allowing its recovery in the bead-free supernatant after bead pull down (Methods). (B) Each gel represents the analysis of free DNA obtained after incubation of the substrate (DNA containing difNg or difGGI) with XerCDNg, t-FtsKαβγEc or both. The “total DNA” control was obtained by heat denaturation of the different DNA-bead complexes. The “% protection” represents the difference of free DNA obtained after t-FtsKαβγEc incubation in absence and presence of XerCDNg (mean of at least three independent experiments with SDs).

