Fig. 2.
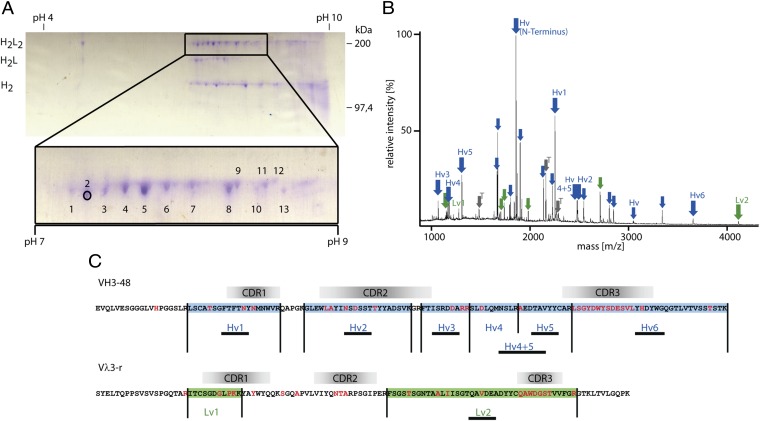
Analysis of matching H and L chains of OCB from patient MS1 yielding rOCB-MS1-s2. (A) Nonreducing 2D gel electrophoresis of antibodies from a CSF sample. For the first dimension, an IEF gel was run, and for the second dimension, SDS/PAGE was performed. Most spots were detected between pH 7.0 and 9.0 (see detail). The positions of the H2L2 heterodimers, the H2L, and H2 complexes (left) and a mass scale (right) are indicated. Single spots of H2L2 heterodimers were excised, digested with trypsin, and analyzed by mass spectrometry. Spot 2 is indicated by a circle. (B) MALDI-TOF spectrum of spot 2 from A. The relative peak intensities are plotted as a function of the mass-to-charge ratio m/z. Peptides from the IgG-H (blue arrows) and IgG-L (green arrows) chains are indicated. Peaks representing peptides from VN(D)NJ-regions are termed “Hv” and “Lv” followed by a number. Peaks from the constant regions are indicated by arrows only. Peaks from trypsin are indicated in gray. (C) Deduced amino acid sequences of the H and L chains as obtained by cDNA sequencing. Peptides identified by mass spectrometry are numbered and highlighted in blue and green. Peptide sequences verified by tandem mass spectrometry are underlined. Amino acids introduced by somatic hypermutation or V(D)J recombination are highlighted in red letters. The putative positions of the complementarity determining regions CDR1, CDR2, and CDR3 regions are indicated.

