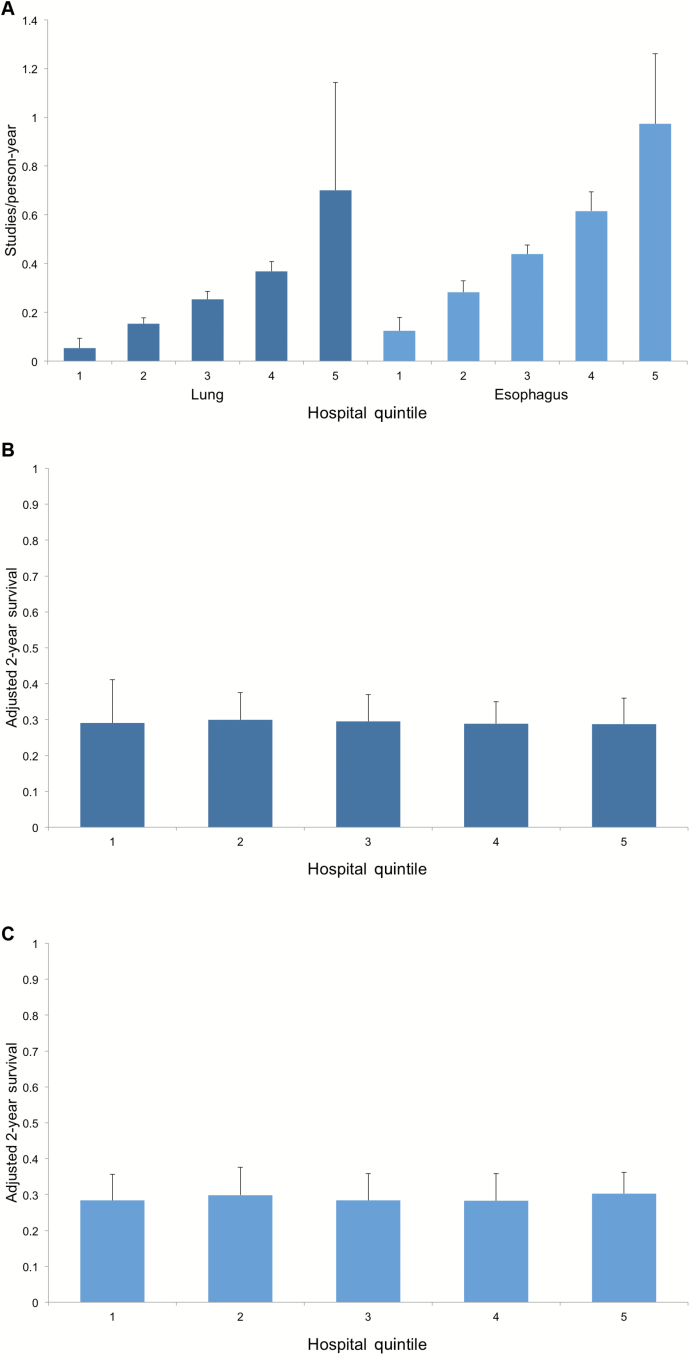
Figure 1.
Mean hospital-level positron emission tomography (PET) utilization and survival. A) Shows mean PET utilization across hospital quintiles for lung and esophageal cancers. B) Demonstrates mean adjusted two-year survival in these same quintiles for lung cancer. C) Represents mean adjusted two-year survival in these same quintiles for esophageal cancer. All error bars represent standard deviations.

