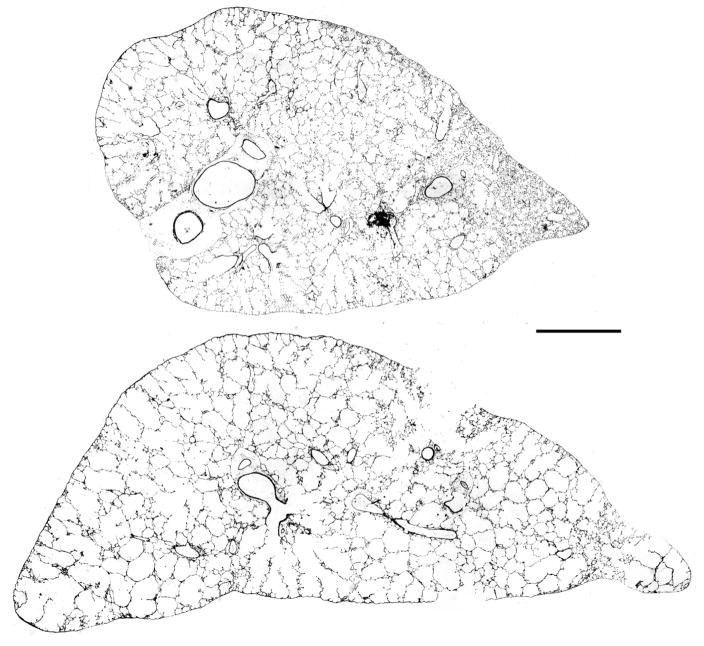
Figure 1.
Low power (2.5x) images of sections of the left lung from two of the elastase treated mice that had very different Lm. In the mouse lung shown in the upper section, there is considerable heterogeneity of the damage, whereas in the lung from another mouse shown in the lower section, the damage seems more uniform with a more severe degree. The mean Lm averaged from all the sampling densities done in each mouse shown was 68 μm in the upper lung and 134 μm in the lower lung. Bar = 1000 μm.

