Figure 4.
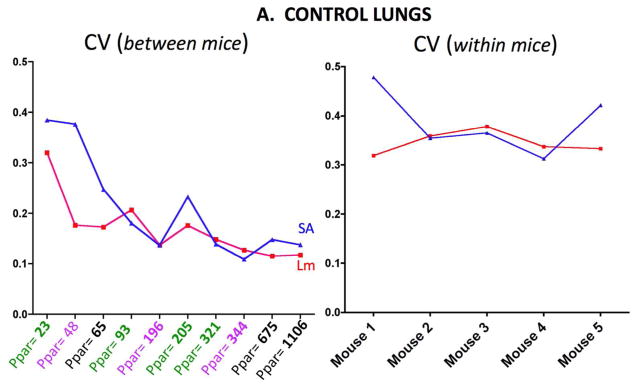
Figure 4A. CV (SD/mean) in control lungs for Lm and Surface Area (SA) measurements between mice (left panel) and for measurements within mice (right panel). The between mice abscissa shows the total number of parenchymal points (Ppar) counted.
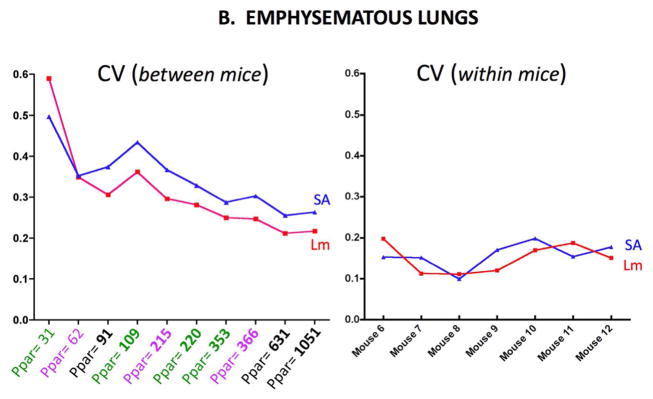
Figure 4B. CV (SD/mean) in emphysematous lungs for Lm and Surface Area (SA) measurements between mice (left panel) and for measurements within mice (right panel). The between mice abscissa shows the average number of parenchymal points (Ppar) counted.


