
Fig. 5.
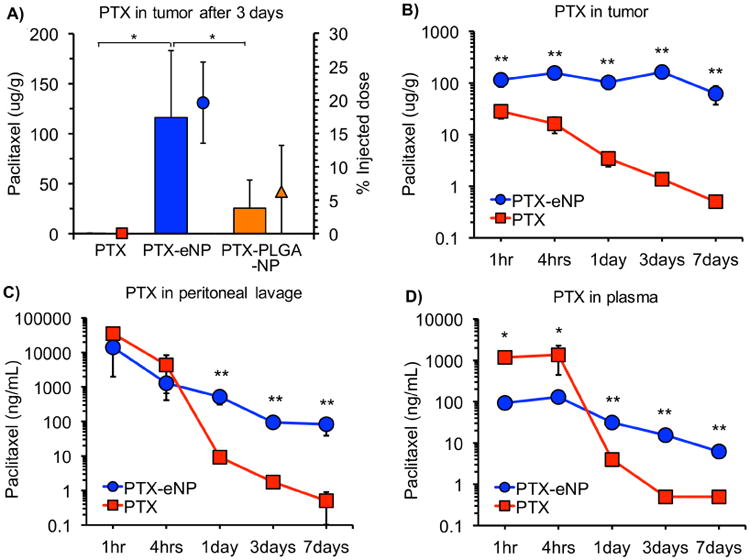
Paclitaxel concentrations in established tumor tissues, peritoneal lavage, and plasma after single bolus treatment injection given 14 days after inoculation with MSTO-211H tumor cells in NU/J mice. PTX-eNPs, PTX-PLGA-NPs or PTX (all at 10 mg/kg PTX dose) were injected intraperitoneally and tissues subsequently harvested for assessment of PTX levels. (A) PTX concentration in tumor tissues at 3 days (n ≥ 9). Columns represent tissue concentrations. Dots and bars represent percentage of injected dose in tumor tissues. (B, C, D) PTX concentrations in tumor, peritoneal lavage, and plasma as a function of time (n ≥ 3 per time point). Data are shown as mean ± SD (* P < 0.05, ** P < 0.001) Note: Tumor concentration data for PTX-eNPs in panel A was previously reported in [45] and is used for comparison. No other data from panels A, B, C, or D has been published.