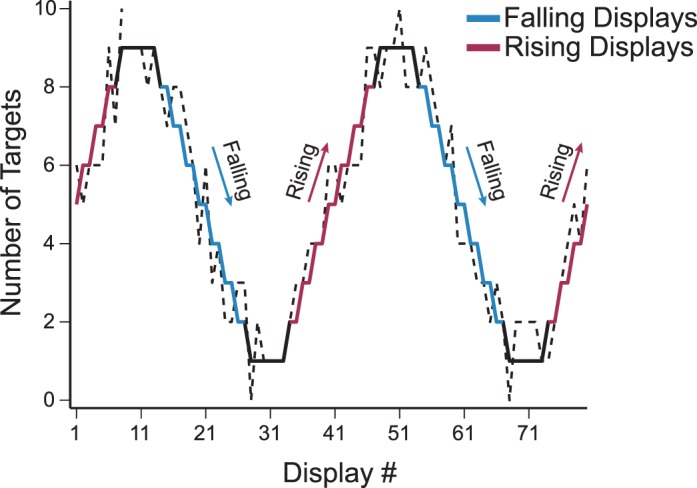
Figure 2.

Target density varied systematically In Experiment 1 via a quantized sine wave pattern between one and nine targets over a period of 40 displays (Solid Line). Target density increased during rising phases (red) and decreased during falling phases (blue). For each participant, we included a one-item jitter on target number. The dashed line is a representative example of what one participant might experience. The 40-period temporal structure repeated until the participant completed the study, with independent jitter for each display.
