
Figure 3.
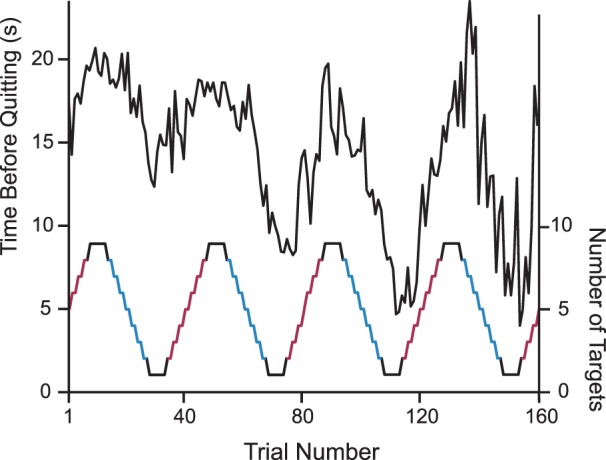
Time before quitting on each trial (black line; averaged across participants) for the first four periods of the temporal pattern of target density (red and blue step function). Participants foraged longer in displays with higher target density.