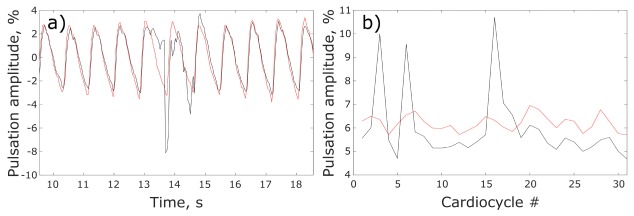
Fig. 4.
Comparison of PPG waveforms in the hot spot measured with and without polarization filtration. (a) Normalized (AC / DC ratio) PPG waveforms obtained under polarized (red curve) and non-polarized (black curve) illumination. (b) Pulsations amplitude as a function of the cardiac cycle for polarized (red curve) and non-polarized (black curve) illumination.

