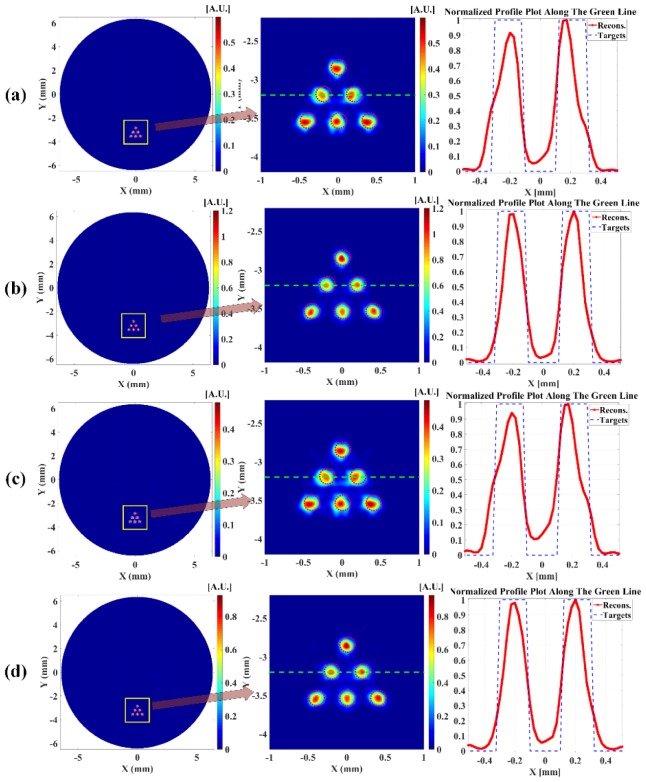
Fig. 12.
Reconstructed XLCT images (left column), zoomed in regions (middle column) and normalized profile plots (right column) for numerical simulation with six targets. (a) Reconstructed XLCT image with single parallel X-ray beam scan; (b) Reconstructed XLCT image with single conical X-ray beam scan; (c) Reconstructed XLCT image with four parallel X-ray beam scan; (d) Reconstructed XLCT image with four conical X-ray beam scan. The dotted green line indicates the profile position.

