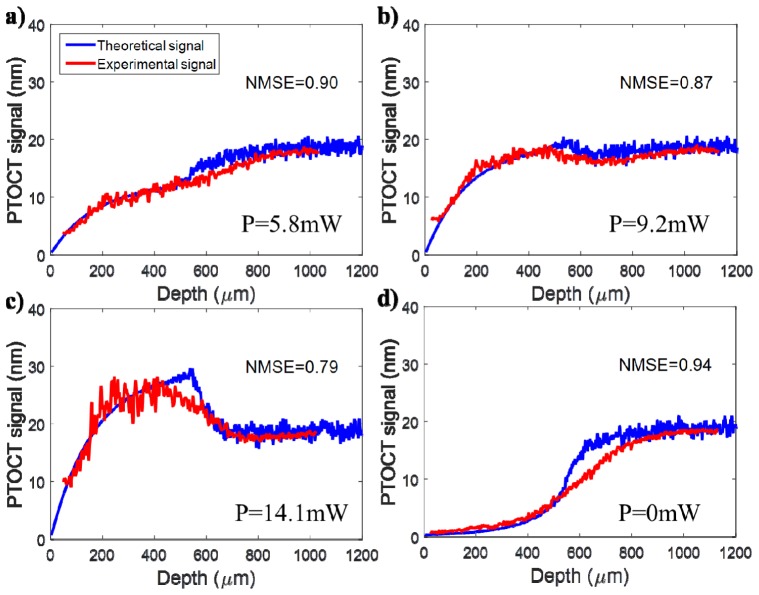
Fig. 4.
Validation of the PT-OCT analytical model over an A-scan in a single layer homogeneous sample. The theoretical signal (blue) was generated from the model based on the optical properties listed in Table 1 (5mm ICG phantom). The experimental signal (red) is the average A-scan obtained experimentally by performing PT-OCT on a silicone phantom containing ICG as an absorber. The photothermal laser power at the sample was fixed at (A) 5.8 mW, (B) 9.2 mW and (C) 14.1 mW to show the behavior of the signal in relation to the noise floor. The noise floor can be seen in (D) when the photothermal laser is turned off. NMSE: Normalized Mean Square Error.

