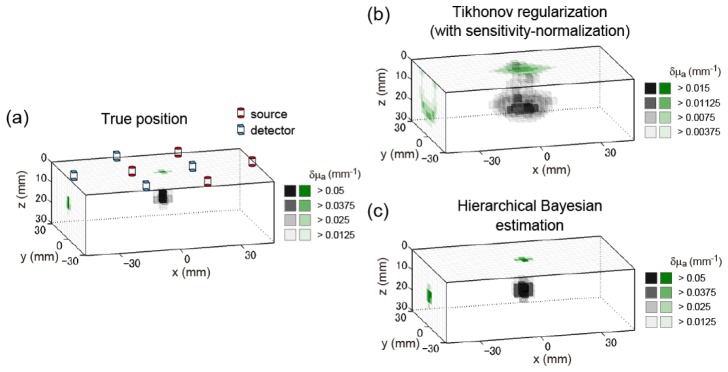
Fig. 5.
Example of 3D reconstruction image of the simulation experiment. The three-dimensional image (tomography) is represented in gray scale. The x-y maximum intensity projection and y-z maximum intensity projection are represented in green scale on the z = 0 surface and on the x = −46.5 cross section, respectively. (a) True distribution of the absorption change. Position of center of absorber is (0, 0, 12.5) [mm]. Red cylinders represent the sources, while blue square prisms represent the detectors. (b) Solution of sensitivity-normalized Tikhonov regularization. (c) Solution of hierarchical Bayesian estimation method.

