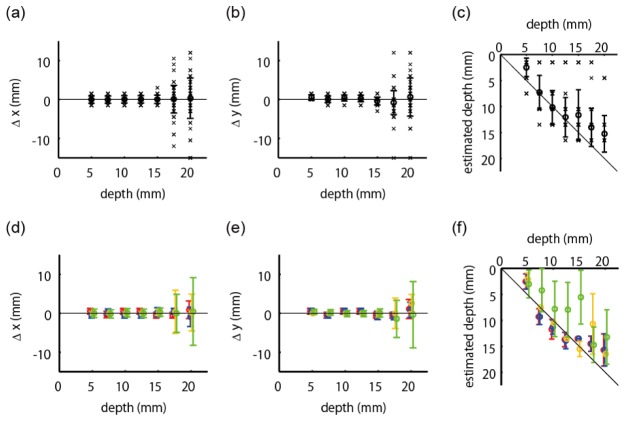
Fig. 6.
Positional errors as functions of true depth of absorption change. The cross mark indicates individual results. The error bar represents meanSD. (a) Positional errors in x direction. (b) Positional errors in y direction. (c) Estimated depths. (d),(e),(f) Positional errors evaluated separately according to the four categories shown in Fig. 4(c). Red, blue, yellow, and green colors represent the data from the source area, detector area, midpoint area, and distant area, respectively. Conventions of Fig. 6(d), 6(e), and 6(f) are the same as in Fig. 6(a), 6(b), and 6(c), respectively, although cross marks are omitted.

