
Fig. 7.
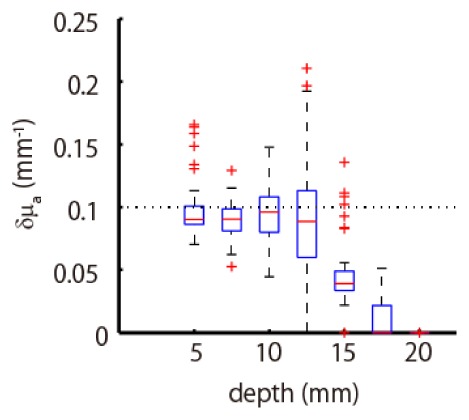
Estimated peak values of absorption change. The true peak value, indicated by the dotted line, was 0.1 mm−1. The boxplot summarizes each value at the depth where the absorption change was located.
Official websites use .gov
A
.gov website belongs to an official
government organization in the United States.
Secure .gov websites use HTTPS
A lock (
) or https:// means you've safely
connected to the .gov website. Share sensitive
information only on official, secure websites.
Estimated peak values of absorption change. The true peak value, indicated by the dotted line, was 0.1 mm−1. The boxplot summarizes each value at the depth where the absorption change was located.